System Model
The software required to be able to open and run this model is VenSIM. VenSIM can be downloaded off of the internet with a few simple clicks for free, as long as you make sure you are using the version for education use and not the versions for commercial and government use. Through VenSIM, you are able to create system models using levels, rates, variables, and arrows, and then later be able to model an interactive graph that changes based off of slider bars controlling the values of your variables.
After downloading VenSIM, all you have to do is open the downloadable file and you'll have the system model pulled up. On the top row, click the green play button labeled synthesim, and you should be able to run your interactive model and see how changing variable values with the slider bars changes the graph.

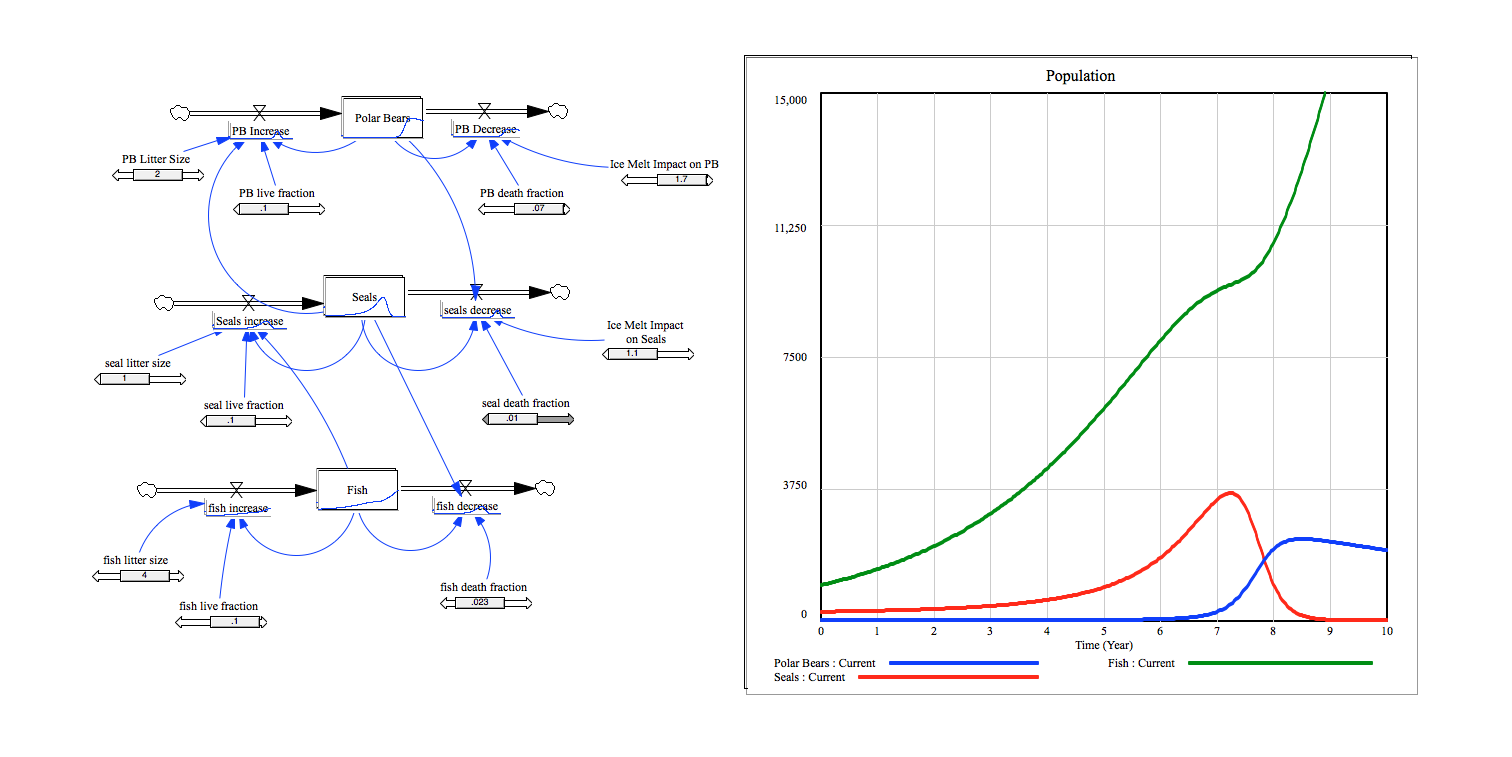
This is our final Vensim model. All of the populations have been scaled down by 1000 in order to make the model more manageable. There are slider bars for every variable which you can interact with to see how they affect the graphs and populations. The graph is also smoother because we used a small time step.

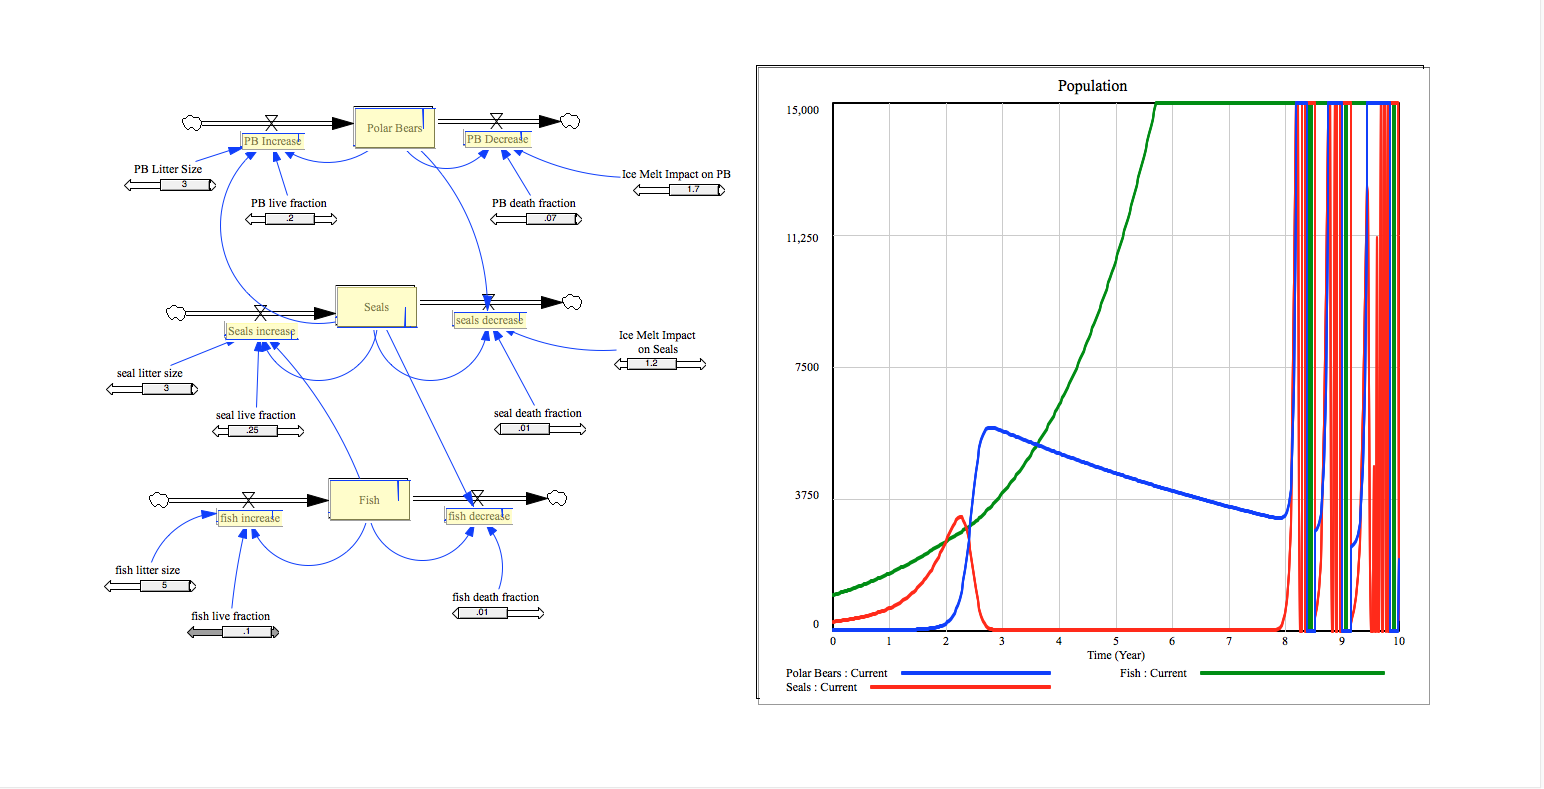
This is one of the Vensim models that we started with. You can see how the values are going crazy because the changes in the populations are too extreme due to the large values that we started with.

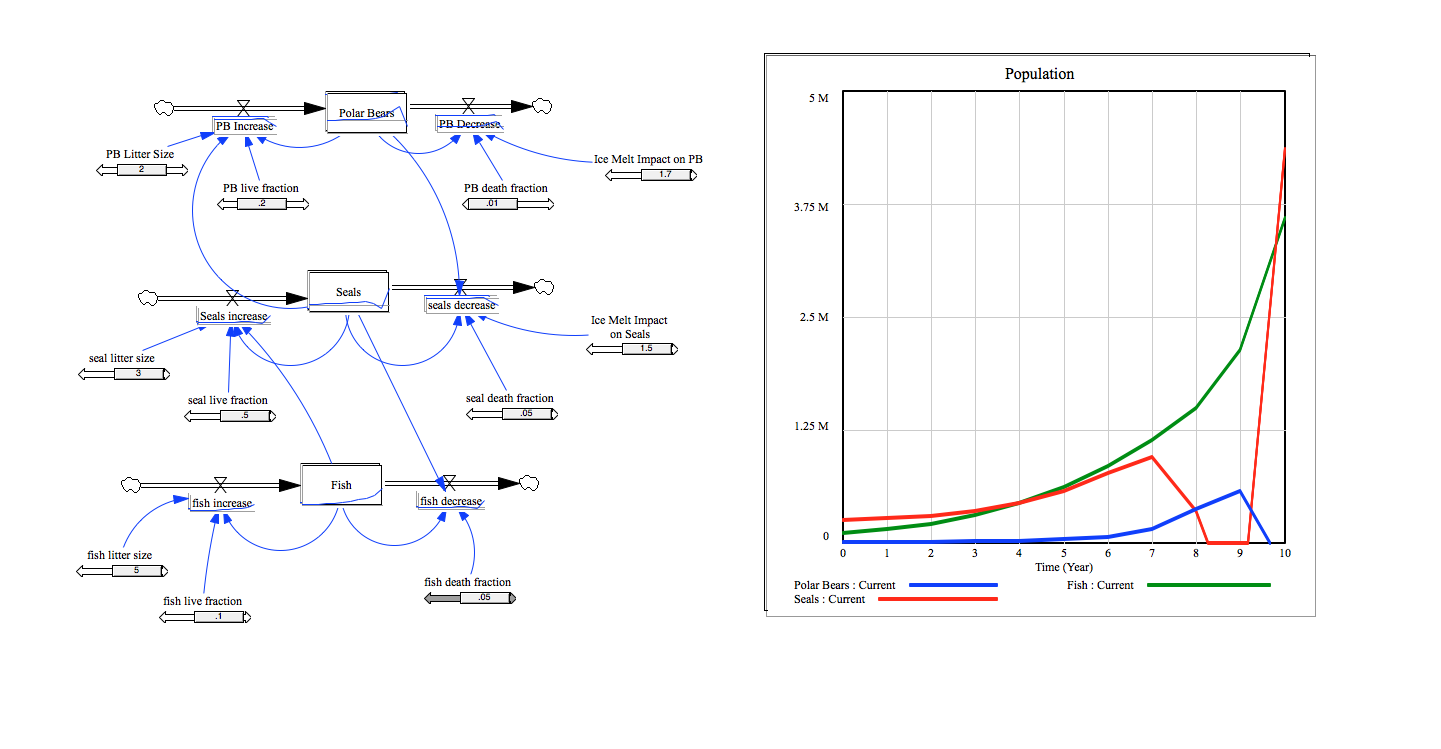
This is another problem we faced when building our Vensim model. Even after we decreased the scale of the populations, the graph was still really rough and spiky because our time step was too large. We fixed this in our final model by making the time step a lot smaller.