Page 3
You should now have 5 or 6 computed initial velocities, one for each landing point. Let's graph these values so we can use them to predict a future lunch.
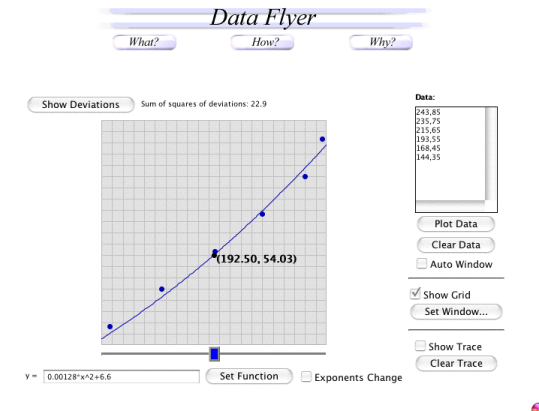
Open up the graphing utility, DataFlyer, and get ready to enter more of your recorded values into it. In the 'Data' field on the right side of the applet, enter your velocity and launching height values in as X,Y pairs, with the X-axis running on velocity.
After you have entered all your data points, select 'Plot
Data', and look at the points displayed. What do you notice about the points?
That's right, they're aligned in, roughly, a curve. you will see that under
the graph area there is a field where you can enter an equation, in the form
of Y = ... X .... Put in .00128*x^2+6.6, and click
'Set Function' (why?). This should
generate a 'best-fit' curve that will come close to matching the data as
plotted. After generating this curve, you can play with the different sliders
to try to move your curve to match the data points better.
Next, we'll figure out where we want the marble to land, and then find out from where we need to release it to get it into our small target!