Page 2
In any engineering endeavor, time is spent building a model, and testing that model to ensure that it is an accurate representatin of the final product. So far, you have built and tested a model of the Daredevil Design Project, and now you need to know if the data you found will accurately predict future events using the ramp.
This is where the applets ProMotion and DataFlyer come into play.
Load the ProMotion applet, and enter data off your Data Table into the applet.
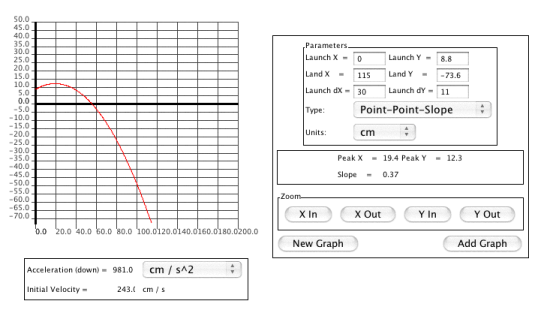
The 'Launch X' field should be left as 0. Enter your finding
for Y1 into the 'Launch Y' field. In the 'Land X' and
'Land Y' fields, enter X1 &
Y2 values respectively. Then fill in your
ΔY, ΔX values into the 'Launch dX' and 'Launch dY'
fields.
Make sure that 'Type' is set to 'Point-Point-Slope' (the
default) and that units are in cm, the click 'New Graph'. You may need to zoom
in or out X or Y a bit to see the full curve computed, but the important thing
to see is the calculaed velocity, labeled 'Initial Velocity' in the lower-left
portion of the applet. Write this number down on your Data Table, next to the X1
entry that you used in ProMotion.
Repeat these steps for each of the X1 entries you
have recorded.