System Model
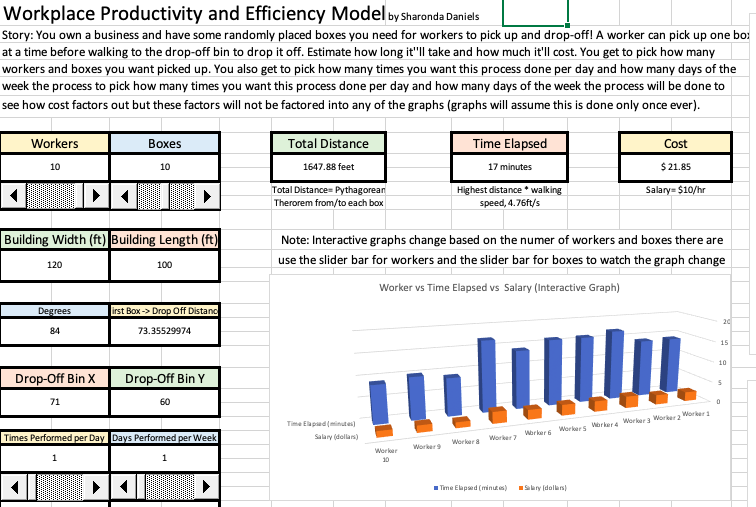
In this model you have some randomly placed boxes and workers. Using the slider bars, you get to
choose how many workers you want and how many boxes should be picked up.
You also get to choose how many times the box pick up/drop-off process should
be done a day and how many days of the week it should be performed. If
wanted, you can even put in your own positions for the workers and the boxes
and have the model calculate those positions instead. The same rules for the
agent model apply to this model, a worker can pick up one box at a time
before walking to the drop-off bin to drop it off. As the total distance is
calculated, so are the costs of the process and the time in which the
process was done.
Using the values that are already set up, I was able to generate some 3D
graphs of the results of each selection. Below the 3D graphs I will explain
some of the trends and anomalies that can be seen and why that may be.
Cost vs Workers vs Boxes
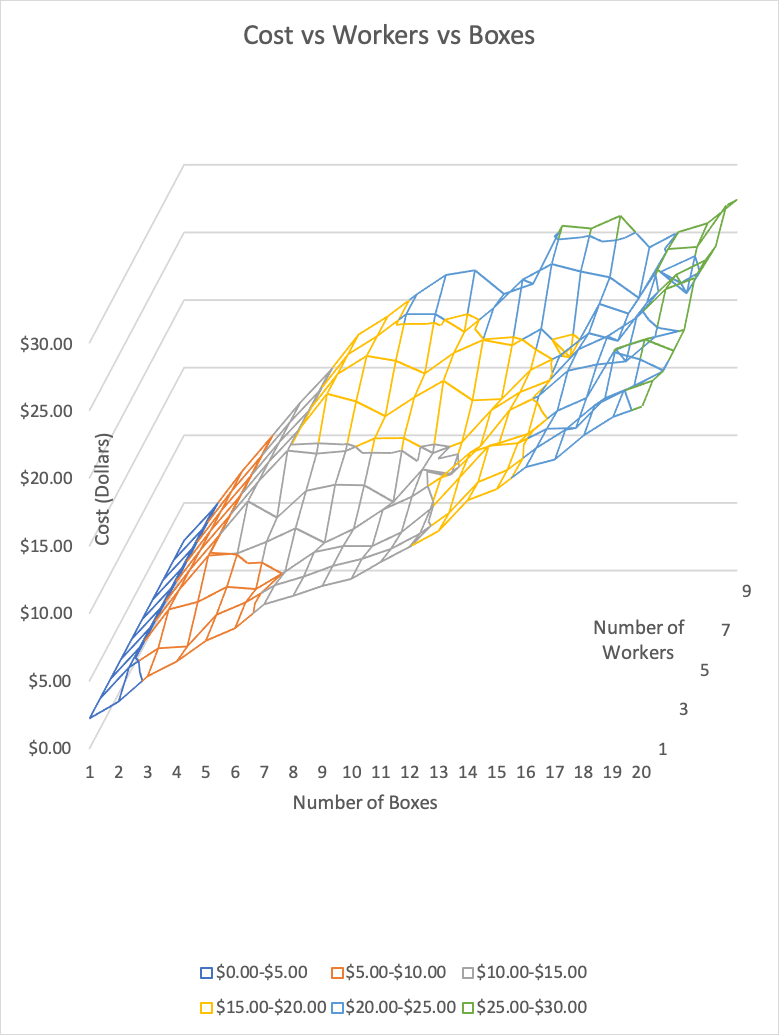
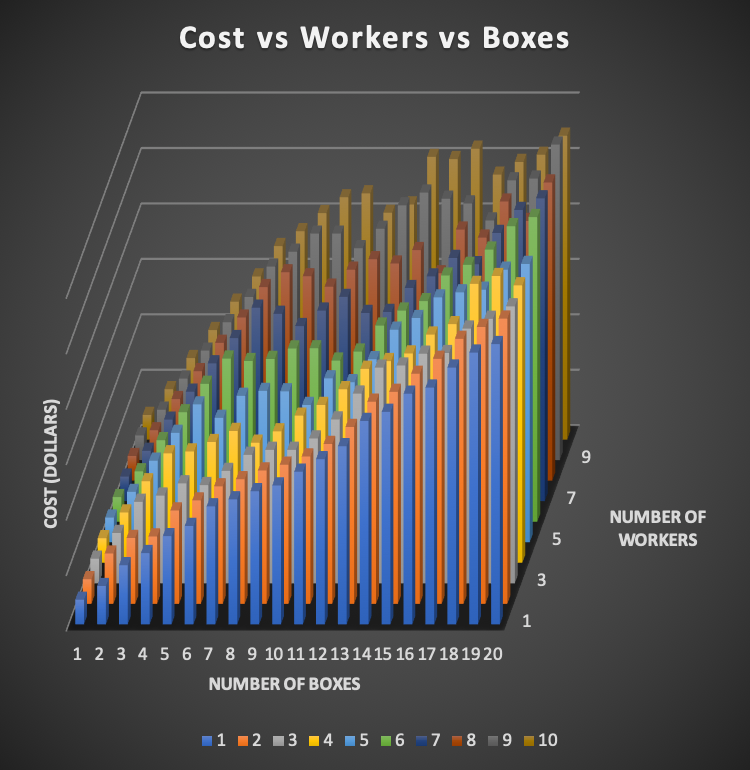 In these pictures one can see that as the number of workers and the number
of boxes go up, so does the cost to pay all of those workers. This is the reason why the maximum values of
10 workers and 20 boxes have the highest value of cost. You may notice that the
lowest cost isn't just at 1 worker and 1 box, but at any amount of workers and
1 box. If you had a lower amount of boxes than workers, you ended up with at
least one worker that didn't pick up any boxes and therefore didn't get paid
anything.
In these pictures one can see that as the number of workers and the number
of boxes go up, so does the cost to pay all of those workers. This is the reason why the maximum values of
10 workers and 20 boxes have the highest value of cost. You may notice that the
lowest cost isn't just at 1 worker and 1 box, but at any amount of workers and
1 box. If you had a lower amount of boxes than workers, you ended up with at
least one worker that didn't pick up any boxes and therefore didn't get paid
anything.There are some interesting instances where it would actually cost less to have another worker picking up the same amount of boxes than. For example, when it comes to 13 boxes needing to be picked up, having 9 workers costs $22.97 while having 10 workers costs $21.20. If you go to the total distances column (column CR from 70 to 79) you can see that worker 2 and worker 8 are creating the most traveled distance. This makes sense after looking at their coordinates. Worker 2 who starts from a position of (35,41) has to pick up Box 2 as his first box which is all the way at (117,52)! Worker 8 who starts at (5,27) has to pick up Box 11 all the way over at (104,93). When another worker is added is allows some of the boxes to be assigned to another worker who may likely be closer. This allows for a lower distance and therefore a lower cost. Other anomalies will most likely be caused by those two factors, worker position and box position.
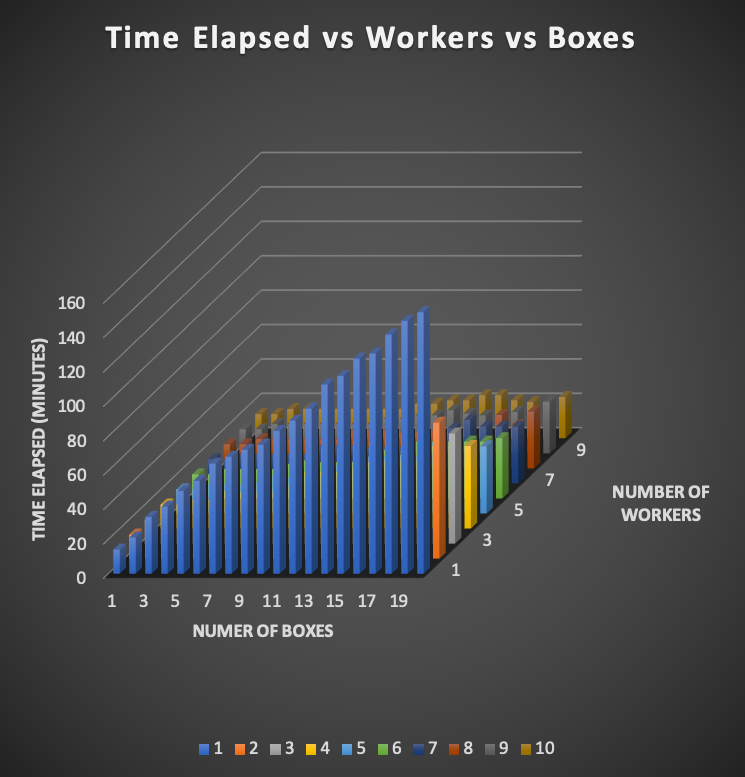
Time Elapsed vs Workers vs Boxes
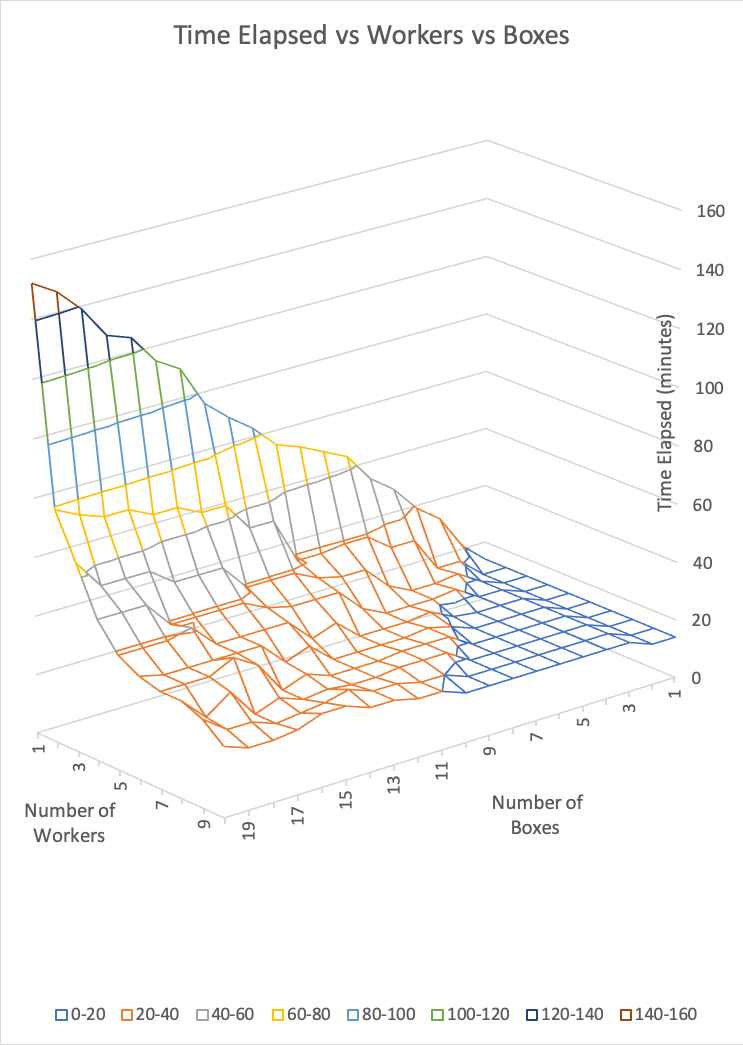
 Note: Time Elapsed was calculated by taking the max value of the time elapsed
between all the workers, not by adding all of the times together. These workers
pick up boxes at the same time as their peers and do not wait until one worker
finished picking up their boxes.
Note: Time Elapsed was calculated by taking the max value of the time elapsed
between all the workers, not by adding all of the times together. These workers
pick up boxes at the same time as their peers and do not wait until one worker
finished picking up their boxes.These pictures show that as the amount of workers decrease and the number of boxes increase, time elapsed increases. This is because when you assign one worker all the boxes it takes longer than splitting the number of boxes amongst other workers. So while having one worker pick up 20 boxes is the most cost efficient, it is the least time efficient. This is where businesses differ: some businesses need their tasks done in a decent amount of time, others don't. Some businesses have certain tasks that should be done in the least amount of time while for other tasks it may not be as necessary. It is crucial that a business determines what goal each task needs in order to create more efficiency for themselves.
An important thing worth noting is the stark difference between have one worker pick up a certain number of boxes and having two workers pick up the same exact amount of boxes. As visibly seen in the second graph, time nearly cuts down a half just by adding another worker. As more and more workers are added this difference becomes less and less making almost an exponential curve (decay) which can easily be seen in the first graph. This is because as you add more workers, placement of those workers starts to matter more than how many there are. It doesn't matter if you have 10 workers, if you have one worker that takes an hour to pick up a box while others pick theres up in 40 minutes, the amount of time it took for the process to be completed will still be an hour and the problem of this worker taking forever to pick up a box is probably due to poor placement of the worker.
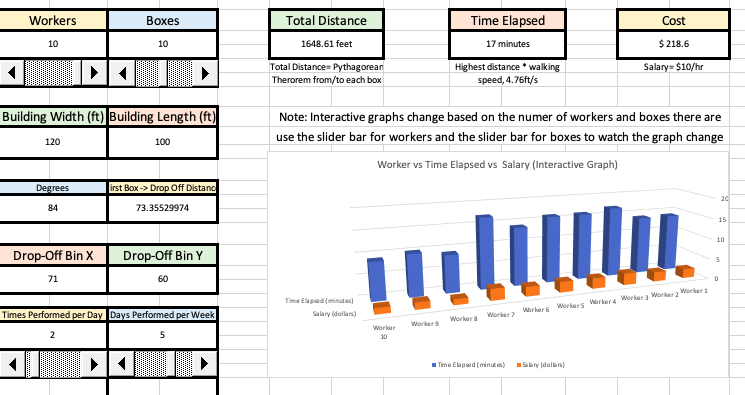
How This All Adds Up: An Experiment
To see just about how much one factor can change the cost of a process for a business, I decided to experiment with worker position:Picking Worker 2 for this Experiment:

 I decided to use Worker 2 (who has been assigned to Box 2) and change
Worker 2's coordinates to 0,0. I didn't change any other aspect (I decided
for this process to be done 2 times per day and 5 days per week).
Here are the recorded results:
I decided to use Worker 2 (who has been assigned to Box 2) and change
Worker 2's coordinates to 0,0. I didn't change any other aspect (I decided
for this process to be done 2 times per day and 5 days per week).
Here are the recorded results:Before Changing the Coordinates:
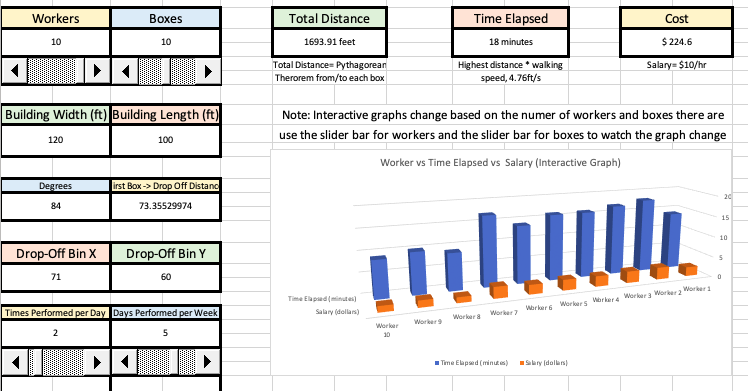
After Changing the Coordinates:
As you can see, cost jumped from $218.60 to $224.60, a $6 difference
for one week. This isn't too bad, but if you plan to have this done the
entire year that lost money gets multiplied by 52 (because there are 52 weeks
in a year) and all of the sudden, choosing to place this one worker at (0,0) has
costed your company $312 a year. This still may not be very bad for some companies, but this can
add up even more if this isn't the only worker not placed in more efficient
locations. This can also add up if you plan to have this done more than 2 times
a day or more than 5 times a week. It isn't the best idea if the worker can
be placed somewhere else more efficient. Overall, if a business knows a process
will be done for awhile, beforehand, they should do research on what is the most
efficient setup so that they are not losing money over the time it is being done
and are helping to maximize their profits.
After Changing the Coordinates:
As you can see, cost jumped from $218.60 to $224.60, a $6 difference for one week. This isn't too bad, but if you plan to have this done the entire year that lost money gets multiplied by 52 (because there are 52 weeks in a year) and all of the sudden, choosing to place this one worker at (0,0) has costed your company $312 a year. This still may not be very bad for some companies, but this can add up even more if this isn't the only worker not placed in more efficient locations. This can also add up if you plan to have this done more than 2 times a day or more than 5 times a week. It isn't the best idea if the worker can be placed somewhere else more efficient. Overall, if a business knows a process will be done for awhile, beforehand, they should do research on what is the most efficient setup so that they are not losing money over the time it is being done and are helping to maximize their profits.
Versions
Version 6
Final_V6_Workplace_Productivity&Efficiency.xlsx
There is a world with workers, boxes, and a drop-off bin. The variable walking distance retrieves a random value. The variable Walking Distance to Bin returns the distance between the box and the bin. This is done until there are no more boxes left.
- Loop the box grabbing and drop off practice
Version 5
V5_Productivity&Efficiency.xlsx
There is a world with workers, boxes, and a drop-off bin. The variable walking distance retrieves a random value. The variable Walking Distance to Bin returns the distance between the box and the bin.
- Add variable: Walking Distance to Bin
- Add variable: Degrees
- Assign random integer between 1 and 360 to Degrees
- Assign √((sin(degrees)*Walking Distance to Box)^2 + (cos(degrees)*Walking Distance to Box)^2 to Walking Distance to Bin
Version 4
V4_Productivity&Efficiency.xlsx
There is a world with workers, boxes, and a drop-off bin. The variable walking distance retrieves a random value.
- Add variable: Drop-Off Bin
- Add variable: Drop-Off Bin Location X
- Set random integer between 0 and building length to Drop-Off Bin Location X
- Add variable: Drop-Off Bin Location Y
- Set random integer between 0 and building width to Drop-Off Bin Location Y
Version 3
V3_Productivity&Efficiency.xlsx
There is a world with workers and boxes. The variable walking distance retrieves a random value.
- Add variable: Walking Distance to Box
- Assign random integer between 2 and (√building width squared + building length squared)/(4.76sec/ft+((time(min)/45min)*.5) to Walking Distance to Box
Version 2
V2_Productivity&Efficiency.xlsx
There is a world with workers and boxes.
- Add variable: boxes
Version 1
V1_Productivity&Efficiency.xlsx
There is a world with workers.
- Add variable: workers
Version 0
V0_Productivity&Efficiency.xlsx
There is a world.
- Create a new project
- Use naming scheme: V#_Productivity&Efficiency