System Model
This model shows the relationship between CO2 concentrations and average temperature change over time (1980 - present) and the data is represented on a graph. This graph is interactive in which there are slider bars for to see how temperature would be affected if you would move the slider bar up or down (increase or decrease in CO2 concentration). The data should support that an increase in CO2 emissions/concentrations will most likely lead to an increase in the average temperature change. We based our data off by using data from the NOAA and although the numbers aren't exactly alike, ours does not take into account discrepancies such as data abnormalities.
Click here to download the system model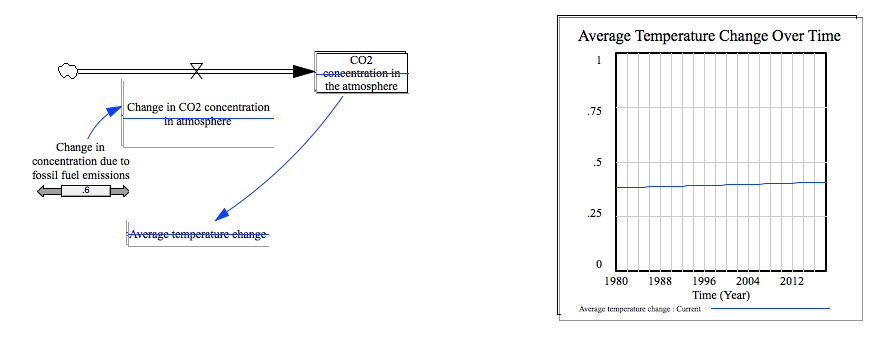
In order to view the downloadable file attached below, you MUST have the program VENSIM. Once you have opened the file on VENSIM, click on the button "SyntheSim" to run the simulation. This file is interactive, as in you must use the sliders in the variables in order to look at the reactions.