![]()
|
|

|
|
|
Nomograms are charts that display mathematical functions. Nomograms are constructed so that the relationship between variables can be displayed as a straight line. In other words, a line connecting two variables will yield the third variable. If C = A X B, then the following nomogram can be drawn: 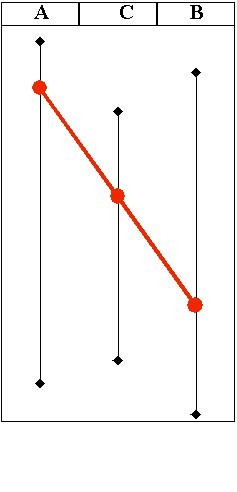
Notice that A, B, and C can all have diffferent scale measure spacing. The adjusted spaces between scales mesaures accomodate the relationship of the nomogram. Nomograms are utilized in orthodontics by displaying the elastic properties of materials. Remember that the elastic properties relate to each other by the following equation: Strength = Stiffness X Range A nomogram for these elastic properties is displayed below: 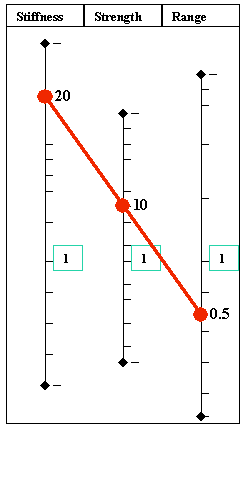
Notice that the units for the three individual scales are not uniformly spaced allowing for a linear display of the elastic properties. Also notice that each scale has a common value at the same level - the value one (1). The common scale measure of one (1) signifies another important characteristic of nomograms -- ratios. Ratios are a method of comparison. Ratios allow you to measure two dissimilar things by comparing them to a common item. Ratio measures are used all the time without you taking notice. If you were asked to compare the weight of an apple and an orange, you would not hesitate to weigh each and compare the apple and oragne in common units (i.e. pounds, ounces, grams, etc.). The weight obtained is a ratio of the number of units needed to balance the weight of the apple versus the number of units needed to balance the weight of the apple versus the number of units needed to balanced the weight of the orange. 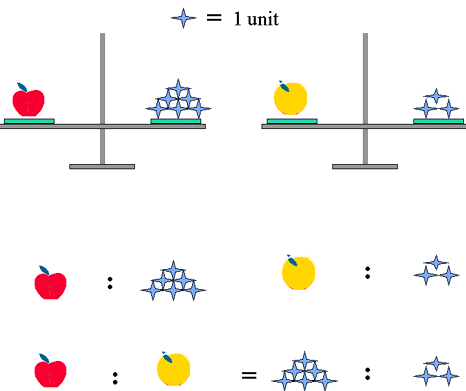
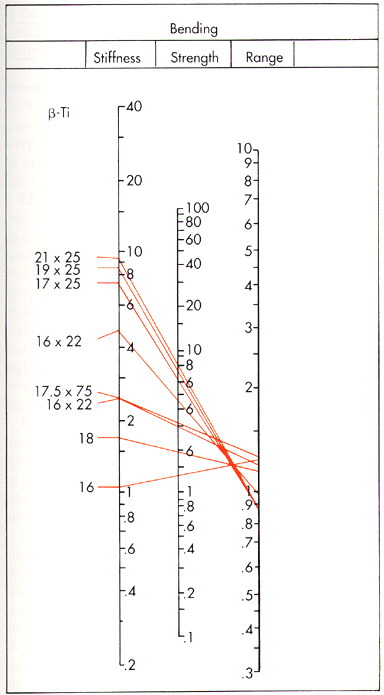
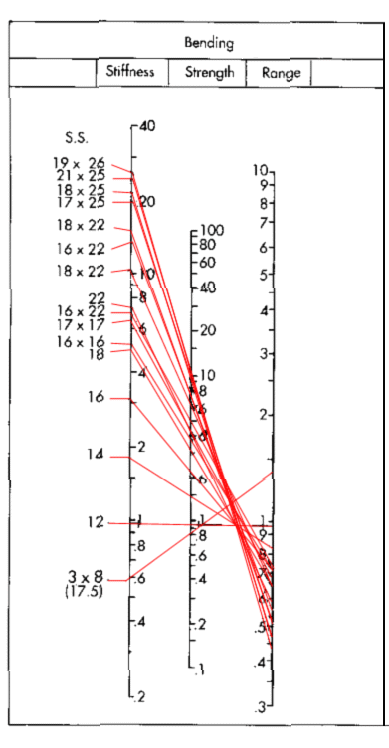
The ratio principle is utilized in orthodontic nomograms by comparing all types of wires to one reference wire. This reference wire is 0.012 inch round Stanless Steel wire (12mil S.S.). Using 12mil S.S. allows you to compare any two wires to each other regardles of size, shape, or type of material. Here are some nomograms for common orthodontic materials. These nomograms consolidate comparisons of many wires into one chart and allow you to evalutate differences in strength, stiffness, and range of many wires at once.
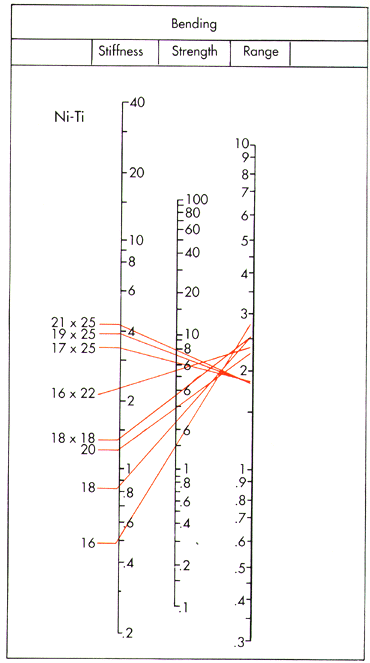
Which wire on the NiTi nomogram has the greatest range?
Which wire on the NiTi nomogram has the greatest stiffness?
Which wire on the NiTi nomogram has the greatest strength?
Last Update: August 20,1998 Please direct questions and comments about this page to appl@net.chem.unc.edu Designed in cooperation with The Shodor Education Foundation, Inc. © Copyright 1998 The University of North Carolina at Chapel Hill |
