Model Description
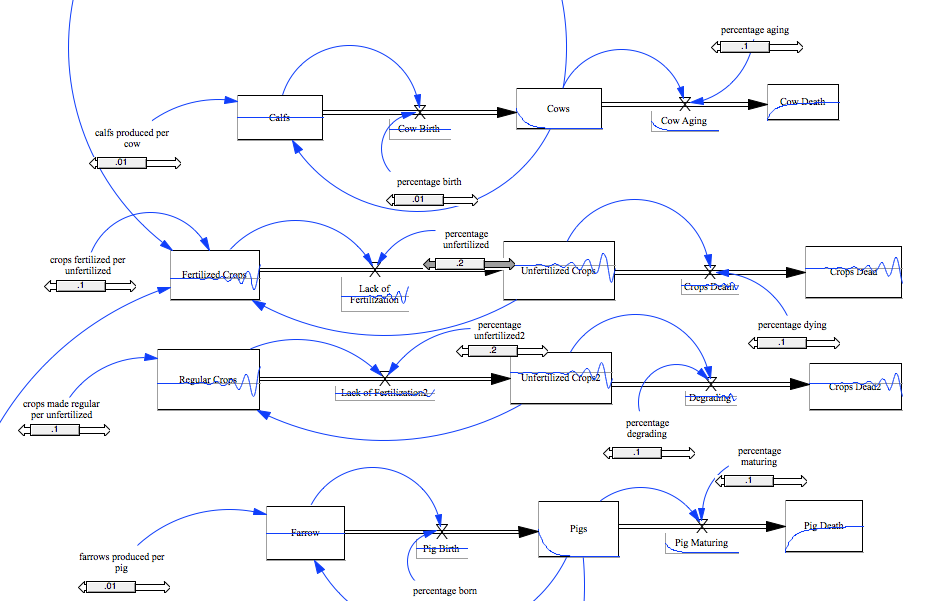
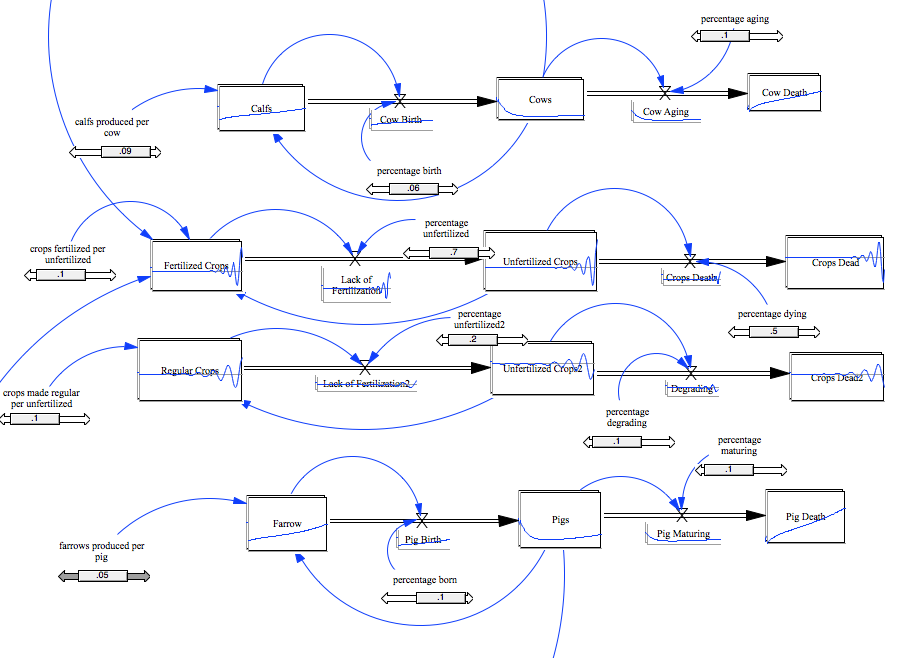
The main goal of my Vensim model was to demonstrate the interaction of both crops and livestock in terms of population and allow the users to change the variables as they please.
How to Use the Model
To use this model, just download Vensim. It's free and will only take a couple of minutes. Once you have finished downloading Vensim, click the link to the model to download the model. From there, you can interact with the model as you please.
How Did I Try to Break my Model?
I found out that increasing the "crops fertilized per unfertilized" variable to over 0.5 drastically increases the fertilized crop population. Because of this, I set the maximum value to 0.5.
What Did I Learn From This Model?
This model proved that the populations of fertilized crops are always higher when paired with livestock than without. The graph proves this to be true. The behavior pattern that I notices is that all the crops follow a typical sin-wave like population curve. This fluctuating behavior is considered normal and healthy, and it indicates that my model values are reasonable.
Screenshots
The model with base values:

The model with altered values:

