The following discussions and activities are designed to lead the students to explore various
incarnations of chaos. This lesson is best implemented with students working in teams of 2,
alternating being the "driver" and the "recorder" using the computer activities.
Objectives
Upon completion of this lesson, students will:
have experimented with several chaotic simulations
have built a working definition of chaos
have reinforced their knowledge of basic probability and percents
Standards Addressed:
Grade 10
Statistics and Probability
The student demonstrates a conceptual understanding of probability and counting techniques.
Grade 9
Statistics and Probability
The student demonstrates a conceptual understanding of probability and counting techniques.
Grade 5
Number Sense
1.0 Students compute with very large and very small numbers, positive integers, decimals, and fractions and understand the relationship between decimals, fractions, and percents. They understand the relative magnitudes of numbers
Grade 6
Algebra and Functions
1.0 Students write verbal expressions and sentences as algebraic expressions and equations; they evaluate algebraic expressions, solve simple linear equations, and graph and interpret their results
Statistics, Data Analysis, and Probability
3.0 Students determine theoretical and experimental probabilities and use these to make predictions about events
Grade 7
Algebra and Functions
3.0 Students graph and interpret linear and some nonlinear functions
Seventh Grade
Statistics and Probability
Investigate chance processes and develop, use, and evaluate probability models.
Statistics and Probability
Making Inferences and Justifying Conclusions
Understand and evaluate random processes underlying statistical experiments
Make inferences and justify conclusions from sample surveys, experiments, and observational studies
Grades 6-8
Data Analysis and Probability
Understand and apply basic concepts of probability
Discrete Mathematics
Data Analysis and Probability
Competency Goal 2: The learner will analyze data and apply probability concepts to solve problems.
7th Grade
Data Analysis and Probability
The student will demonstrate through the mathematical processes an understanding of the relationships between two populations or samples.
Grade 6
Patterns, Relationships, and Algebraic Thinking
4. The student uses letters as variables in
mathematical expressions to describe how one quantity changes when a related quantity changes.
Probability and Statistics
9. The student uses experimental and theoretical probability to make
predictions.
Grade 7
Patterns, Relationships, and Algebraic Thinking
3. The student solves problems involving direct
proportional relationships.
Grade 8
Probability and Statistics
11. The student applies concepts of theoretical and experimental probability
to make predictions.
Student Prerequisites
Geometric: Students must be able to:
recognize and sketch objects such as lines, rectangles, triangles, squares
Arithmetic: Student must be able to:
understand and manipulate basic probabilities
understand and manipulate percents
Technological: Students must be able to:
perform basic mouse manipulations such as point, click and drag
use a browser for experimenting with the activities
Teacher Preparation
Access to a browser
Pencil and calculator
Copies of supplemental materials for the activities:
Chaos is the breakdown of predictability, or a state of disorder
experimental probability
The chances of something happening, based on repeated testing and observing results. It is the ratio of the number of times an event occurred to the number of times tested. For example, to find the experimental probability of winning a game, one must play the game many times, then divide the number of games won by the total number of games played
iteration
Repeating a set of rules or steps over and over. One step is called an iterate
probability
The measure of how likely it is for an event to occur. The probability of an event is always a number between zero and 100%. The meaning (interpretation) of probability is the subject of theories of probability. However, any rule for assigning probabilities to events has to satisfy the axioms of probability
theoretical probability
The chances of events happening as determined by calculating results that would occur under ideal circumstances. For example, the theoretical probability of rolling a 4 on a four-sided die is 1/4 or 25%, because there is one chance in four to roll a 4, and under ideal circumstances one out of every four rolls would be a 4. Contrast with experimental probability
Lesson Outline
Focus and Review
Remind students what has been learned in previous lessons that will be pertinent to this lesson
and/or have them begin to think about the words and ideas of this lesson:
Does anyone know what predictabilty means?
Can anyone explain what chaos means?
If I lit a fire in the middle of the room can anyone predict what else would catch on fire?
What would influence the way the fire might spread?
Objectives
Let the students know what it is they will be doing and learning today. Say something like this
Today, class, we are going to learn about probability and chaos.
We are going to use the computers to learn about probability and chaos, but please do not turn
your computers on until I ask you to. I want to show you a little about this activity first.
Teacher Input
Lead a class
discussion on basic probability to prepare students for working with the activities.
Guided Practice
Have the students try the computer version of the
Fire! activity to investigate how large the burn probability can be and still consistently have
trees left standing. Allow the students about 20 minutes to explore computer activity.
Ask the class to think about why the fire activity is not very realistic. Be sure the point
that controlling the probability of the spread of the fire is out of a person's hands.
Motivate the next activity by pointing out that if we assume that fire will spread 100% of the
time, then leaving some empty space in the forest (which a person can control) may keep the
entire forest from burning.
Have the students try the computer version of the
Better Fire! activity to investigate how large the forest density can be and still consistently have trees
left standing after a fire.
Lead a class
discussion on how prevalent chaos is in science.
Independent Practice
Have the students try the computer version of the
Game of Life activity to investigate this classic demonstration of chaos. Allow the students about 20
minutes to explore computer activity.
Have the students try the computer version of the
Rabbits and Wolves activity to investigate how the effects of small changes in the initial values of things
changes the outcomes. Allow the students about 20 minutes to explore computer activity.
If you choose to hand out the accompanying worksheets you can have the students complete them
now.
Closure
You may wish to bring the class back together for a discussion of the findings. Once the
students have been allowed to share what they found, summarize the results of the lesson.
Alternate Outline
This lesson can be rearranged in several ways.
Reduce the number of activities; for example, use only the
Better Fire! and
Game of Life activities to give the classic examples of simulations with chaotic behavior.
Add the additional activity using the
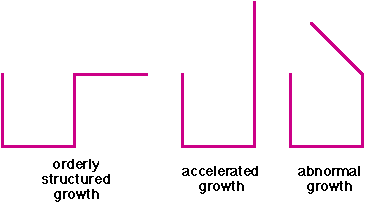
Flake Maker activity with the following three starting shapes:
Use the results of these three generators as an analogy for how small changes in structure
cause large changes in cell growth in biology.
Suggested Follow-Up
After these discussions and activities, the students will have seen more ways in which chaos,
first introduced in the
Fractals and the Chaos Game lesson, is used to model behavior. The next lesson,
Pascal's Triangle , reintroduces Sierpinski-like Triangles, as seen in the
Geometric Fractals and
Fractals and the Chaos Game lessons, in yet another way, demonstrating the rich connections between seemingly different kinds
of math.