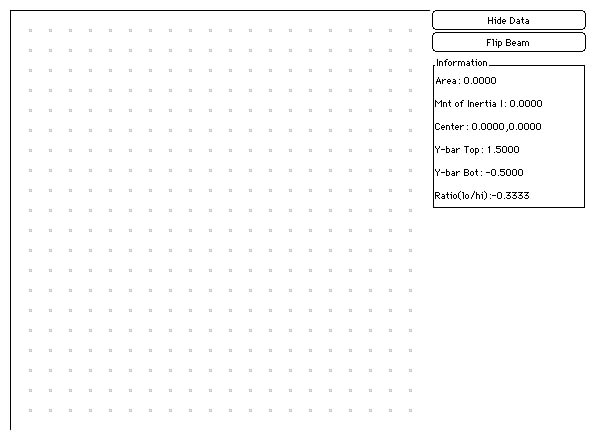
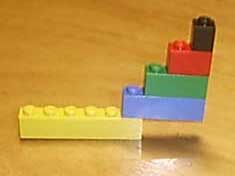
If we were using cinder blocks instead of Legos, we would quickly grow tired of stacking and fastening the heavy blocks, and might look for an easier way to experiment. A computational model allows us to easily do problems that might be difficult or expensive. In addition, the computer can also do quick calculations regarding our designs and use graphics to help us visualize (get a picture of) certain information. Click for the Cross-Section Applet, which should come up in a new window. You should see a grid of points along with a table of data - something like this:
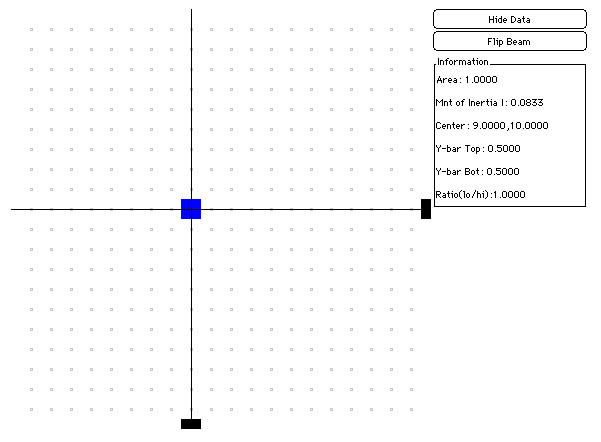
Clicking near a point on the grid will place (or erase) a blue square at that location. Notice that the thin black lines move and the numbers in the data table change with the addition of a new square!
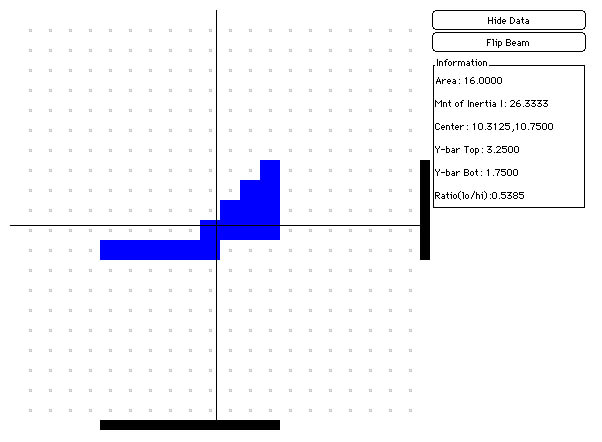
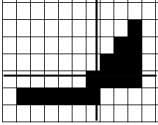
We can continue to add blue squares in the computer model to form the shapes of the structures we have already tested, similar to the way we recorded the structural shapes on the graph paper. Notice that the thin black lines move each time a square is placed or erased, meaning that they likely represent something about each structure. Record the location of the lines from the computer model on your graph paper records. What do you suppose the lines represent?
|
|
|
| On to page 7! |
 The Shodor Education Foundation, Inc.