| |
|
Satellite Maps
There are a wide variety of satellite maps available, in addition to the surface plots described above. These maps are fairly simple to understand, but they contain a lot of information in the hands of a trained meteorologist:
| Visible (Vis):
Visible images are black and white graphics that show cloud cover and/or snow on the ground. The images work because the satellites capture reflection off of the clouds or snow cover, which appear as bright areas; the brigher they are, the thicker the cloud cover. These images are, of course, only available during daylight hours. Ocean surfaces and non-hidden land areas show up as dark. |

|
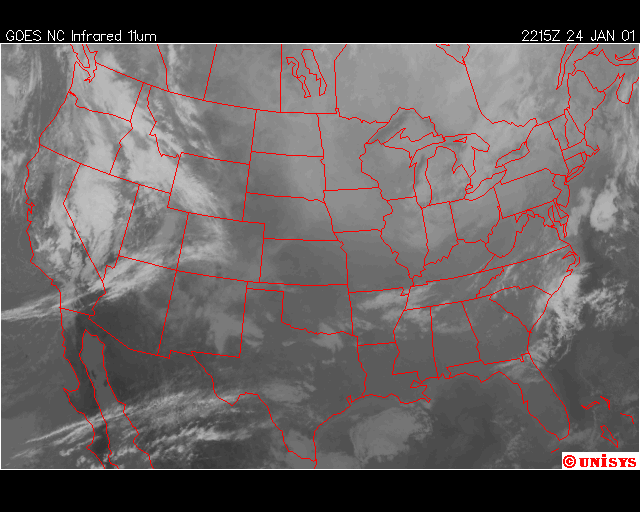
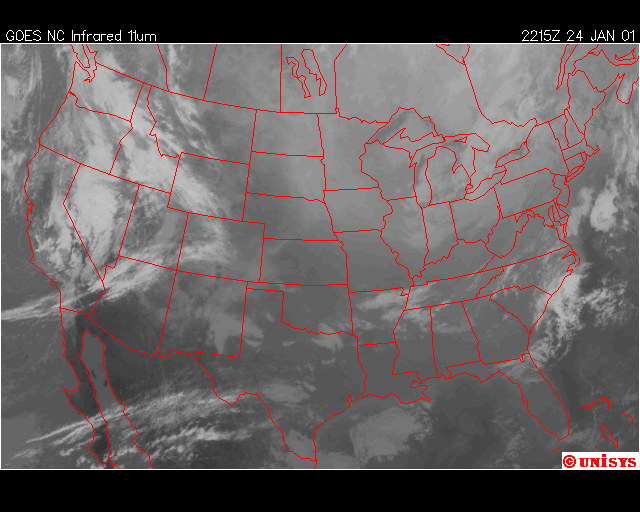
| Infrared (IR):
These images take advantage of heat being radiated off of the surface, showing up in the infrared part of the electromagnetic spectrum. Surfaces that are cooler, such as areas covered with clouds, show up as bright areas and warm areas, such as the ocean, are dark. There is some differentiation available between types of clouds: low clouds are more gray in color, while tall clouds (including thunderstorms) show up as bright white on the map. IR images can be captured 24 hours/day. IR maps are available in five sectors: east, west, hemisphere, US, and regional. |

|
| Enhanced Infrared (Enh IR):
Enhanced IR maps use the same satellite data as for IR maps, but the data is "enhanced" to make cloud heights easier to visualize. The higher the cloud, the colder the reflection, and these are shown as brigher areas on the chart. The charts also show thunderstorm activity as blue and green regions. More detail on the color coding for these charts is available in a separate window. |

|
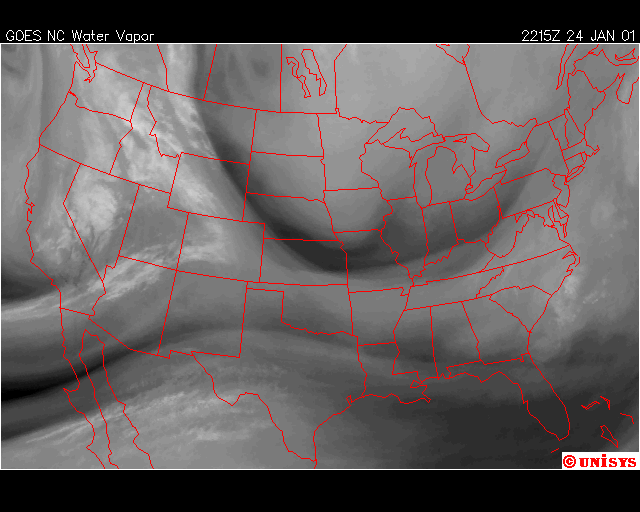
| Water Vapor (WV):
Again, using IR technologies, we can show the areas of the country that have the highest areas of moisture. Bright areas on the chart show the presence of high clouds that result from jet streams or from thunderstorm activity. Dark areas are locations that are dry at high altitudes. If you follow a bright "streak", you wil be able to "see" the location of the jet stream. |

|
The chart below is presented as a "quick quide" to the use of satellite images in evaluating the presence of different types of clouds:
| Types of Clouds |
Image Type |
Interpretation |
| Low Clouds |
|
Visible
|
|
Infrared/Enhanced Infrared
|
| Water Vapor |
|
| Low clouds look bright on visible images, since a significant amount
of light is radiated back to the atmosphere. If you notice, most low
clouds have a very dark base, signifying that light is not getting
through to the surface. |
| Low clouds appear gray on IR/EnhIR images, since the tops of low
clouds are relatively warm. |
| Since low clouds are so low in the atmosphere, they are detectable
on water vapor images. |
|
| Cirrus Clouds |
| Visible |
| Infrared/Enhanced Infrared |
| Water Vapor |
|
| Cirrus clouds look a bit off-white in color, as compared with the
brighter images of low clouds. Cirrus clouds as seen from the surface
look white, meaning that light is getting through. Some light, however,
is scattered back to the atmosphere, so the images appear as the characteristic
off-white color. |
| Cirrus clouds are quite high in the atmosphere, so they are quite
cold. On IR images, cirrus clouds appear bright white in color. |
| The high-altitude crystals that are found in cirrus clouds appear
as white on water vapor images. |
|
|
Tall Cumulus
Cumulonimbus
|
| Visible |
| Infrared/Enhanced Infrared |
| Water Vapor |
|
| These clouds appear as bright white on visible images, since a significant
amount of radiation is reflected or scattered back to the atmosphere. |
| The tops of these clouds are quite cold, so they appear as bright
white on IR/EnhIR images. |
| As with cirrus clouds, these clouds emit cold (6.7 micron) radiation,
so they appear as white images on water vapor images. |
|
Confused? Have a question? If so, check out the Frequently Asked Questions (FAQ) page or send mail to the OS411 tutor (os411tutor@shodor.org) with your question!
Report technical/content problems here
|
|