|
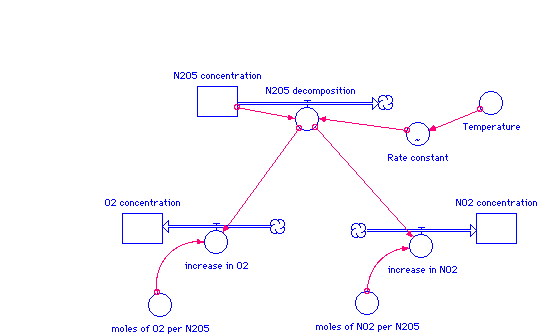
A simple system dynamics model made in STELLA is shown below. STELLA is a modeling tool that shows graphical interface over time. The rectangular boxes represent the changing concentrations over time. The large arrows represent the change processes, such as decomposing N2O5 and increasing O2.

The equations representing this model are shown below.
INIT N2O5_concentration = 2
Temperature = 20+step(100,5)
Rate_constant = GRAPH(Temperature)
(0.00, 0.133), (20.0, 0.25), (40.0, 0.333), (60.0, 0.38), (80.0, 0.405), (100, 0.43), (120, 0.45), (140, 0.472), (160, 0.487), (180, 0.495), (200, 0.5)
N2O5_decomposition = N2O5_concentration*Rate_constant
INIT O2_concentration = 0
INIT NO2_concentration = 0
moles_of_O2_per_N2O5 = .5
increase_in_O2 = N2O5_decomposition*moles_of_O2_per_N2O5
moles_of_NO2_per_N2O5 = 2
increase_in_NO2 = N2O5_decomposition*moles_of_NO2_per_N2O5
N2O5_concentration(t) = N2O5_concentration(t - dt) + (- N2O5_decomposition) * dt
O2_concentration(t) = O2_concentration(t - dt) + (increase_in_O2) * dt
NO2_concentration(t) = NO2_concentration(t - dt) + (increase_in_NO2) * dt
Temperature = 20+step(100,5)
Rate_constant = GRAPH(Temperature)
(0.00, 0.133), (20.0, 0.25), (40.0, 0.333), (60.0, 0.38), (80.0, 0.405), (100, 0.43), (120, 0.45), (140, 0.472), (160, 0.487), (180, 0.495), (200, 0.5)
N2O5_decomposition = N2O5_concentration*Rate_constant
increase_in_O2 = N2O5_decomposition*moles_of_O2_per_N2O5
increase_in_NO2 = N2O5_decomposition*moles_of_NO2_per_N2O5
|

