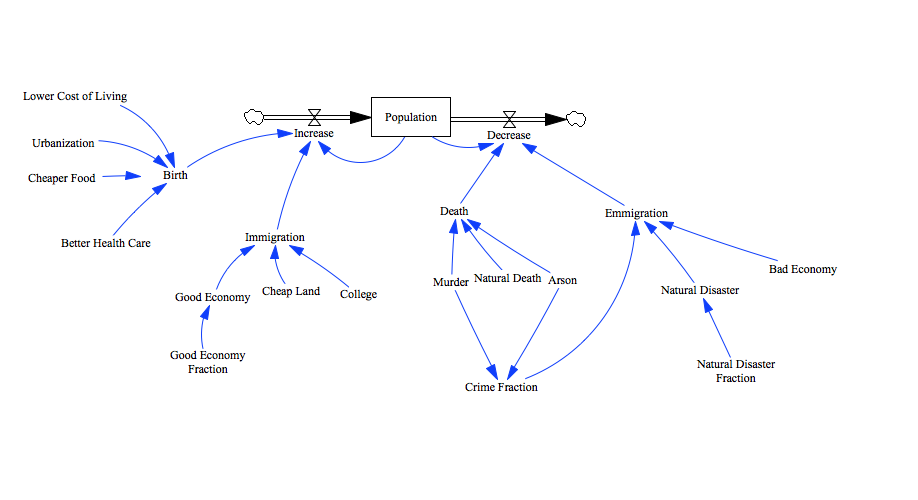
VENSIM MODEL DESCRIPTION
This project will show three different models of how the Population changes in a city within a year. There are many different factors that will be explored. This model shows a visual representation of factors that affect the population to increase or decrease. This visual representation includes arrows, boxes, a graph and sliders with labels and numbers that represent each factor. The arrow in this model represents how the factors are needed to compute the population increase or decrease. The boxes in this model represent the change in the population caused by the factors. Therefore the arrow is connected to the boxes representing the factors affecting the population. Some boxes are connected to more than one arrow because these factors are interrelated with the others. Out of the three models, Vensim is not too difficult to work with and has a visual representation as well as data representation.
