Vensim
Our Vensim model shows a predator vs prey relationship between four prairie species/groups; the plants, grasshoppers, sparrows, and eagles. It shows how the birth and death rate of each species is affected by the other three species/groups. It also shows the population of each species, and how many were born, how many died, and how many were eaten.
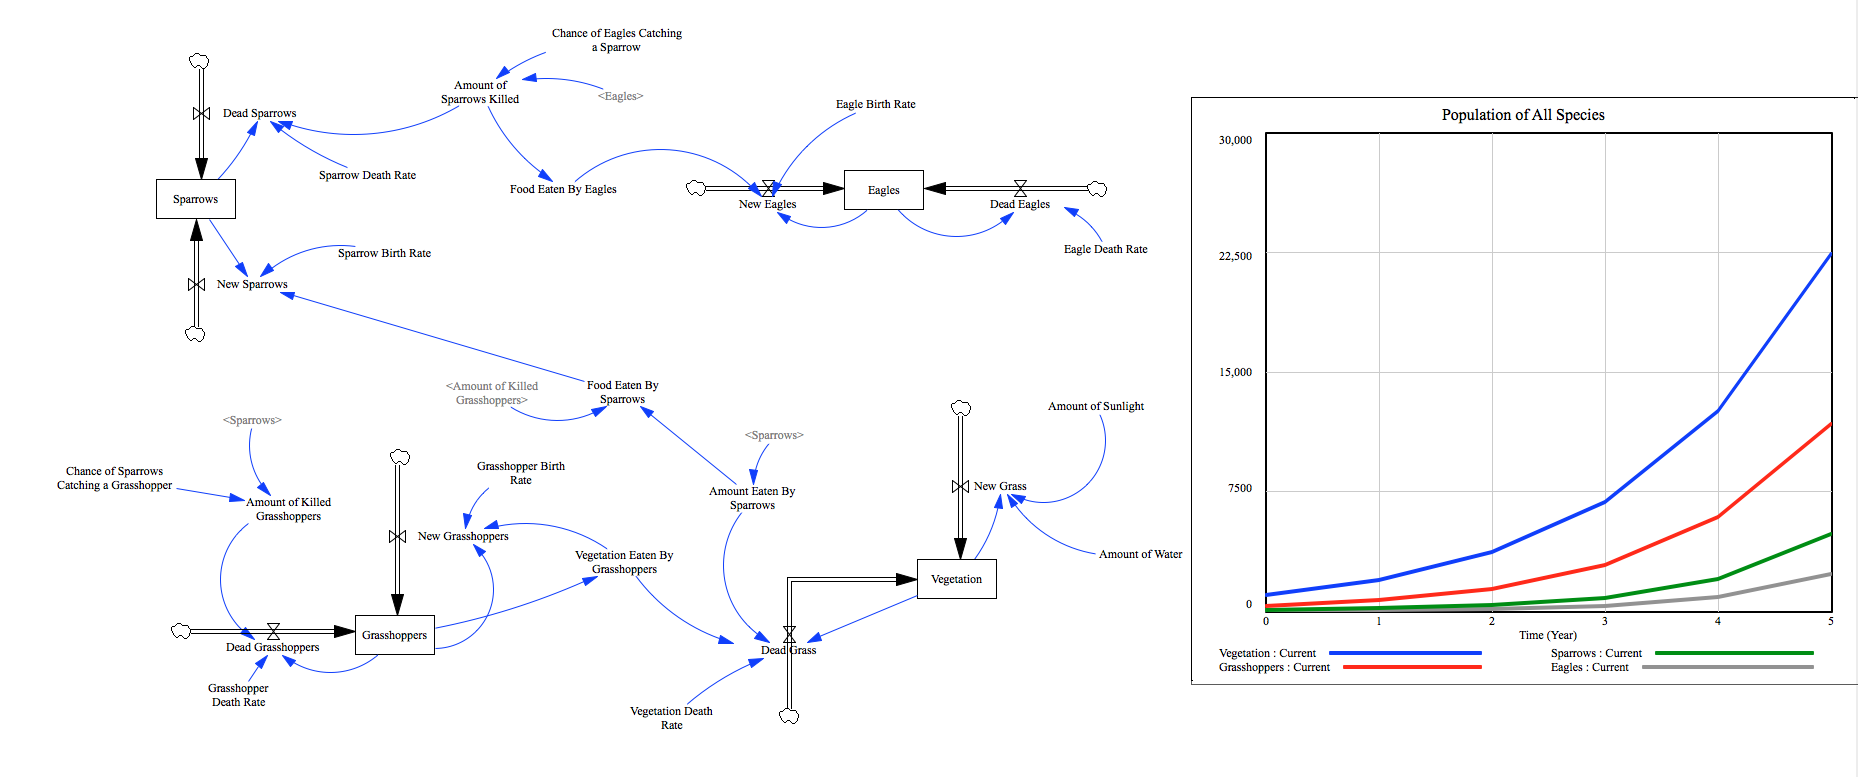
Vensim is good at showing the relationships between each species with arrows, and the overall population of each species. A disadvantage is that, unlike AgentCubes, you cannot see each agent/member of the population move around and interact.
Agentsheets
In our AgentCubes model, there are grasshoppers, sparrows, and eagles. The grasshoppers are of a greenish-yellow hue, sparrows are in a brown bird form, and eagles are grey. They move on the world (plants), and every species has an X percent chance of reproducing. Sparrows have an X percent chance of eating a grasshopper when it is next to one, and eagles have an X percent chance of eating a sparrow when its next to one. Every has an 'age'. Their age goes up when they move, and it goes up a lot when they reproduce. When they reach a certain age, they die. When a member of a species finds and eats a prey, their 'age' resets to zero (so they have longer to live). This way, hunger can be a factor in keeping the population of each species from getting out of control.
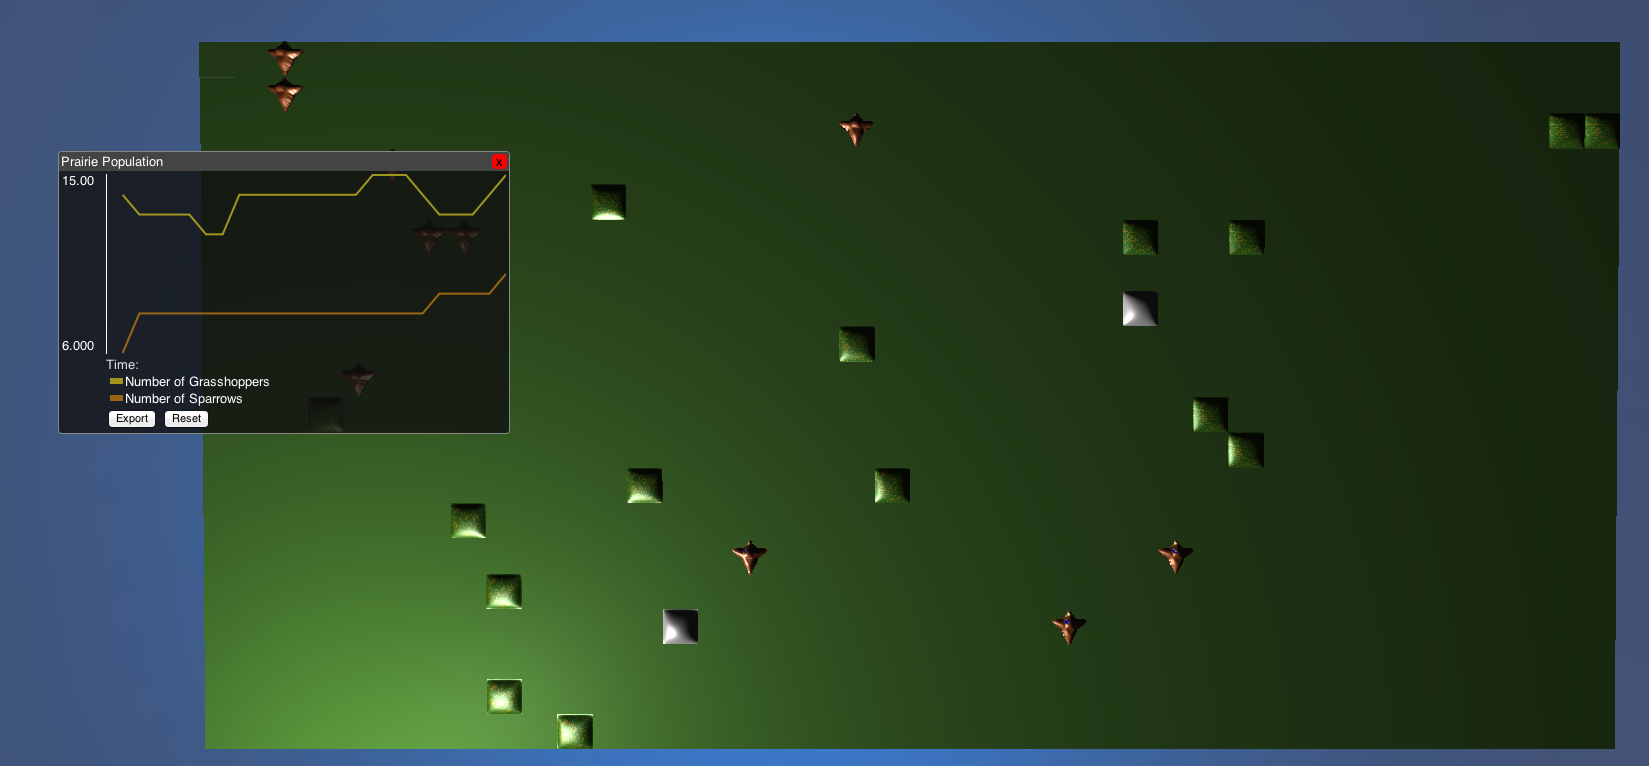
AgentCubes is good at showing individual agents/members and how they they interact and move around in an environment. It is lacking in showing the overall numbers of a population, because you can only have a certain number of agents on in the simulation before your computer lags out.
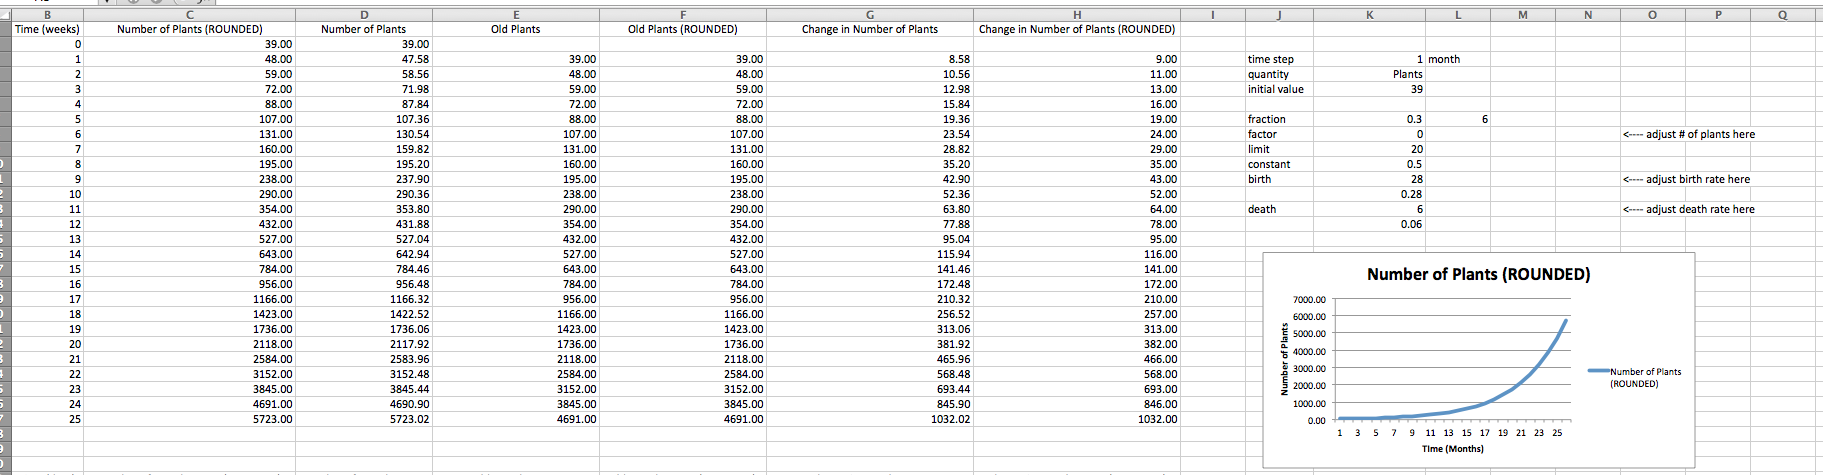
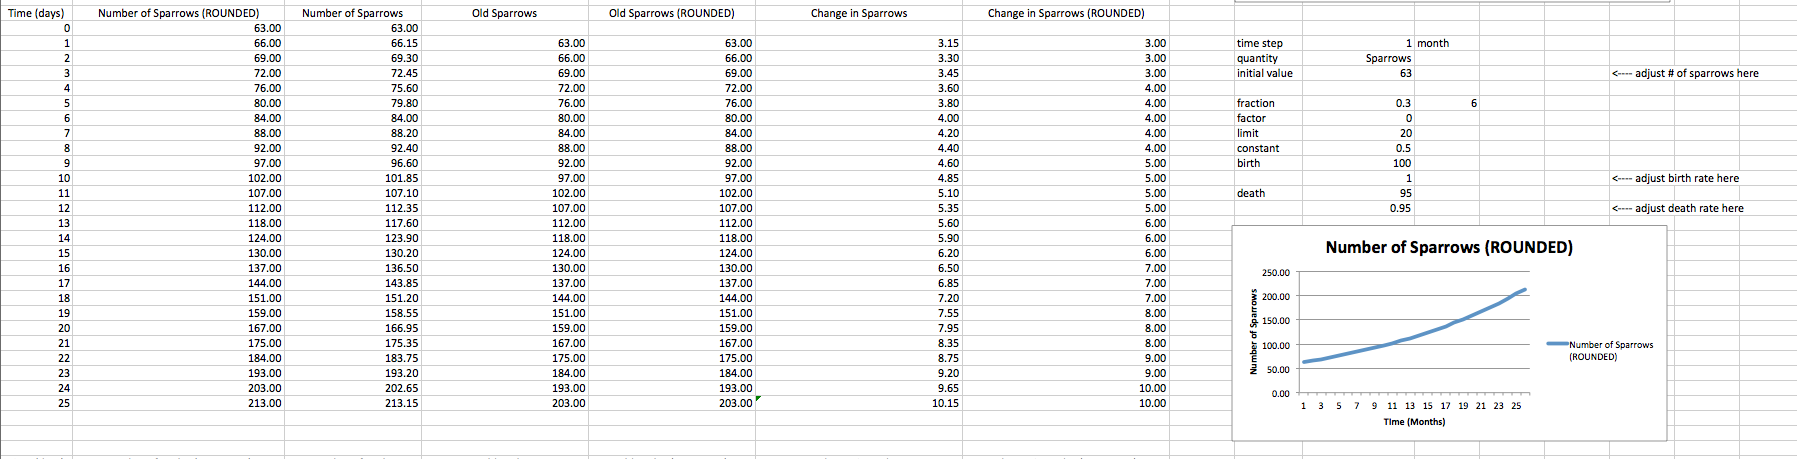
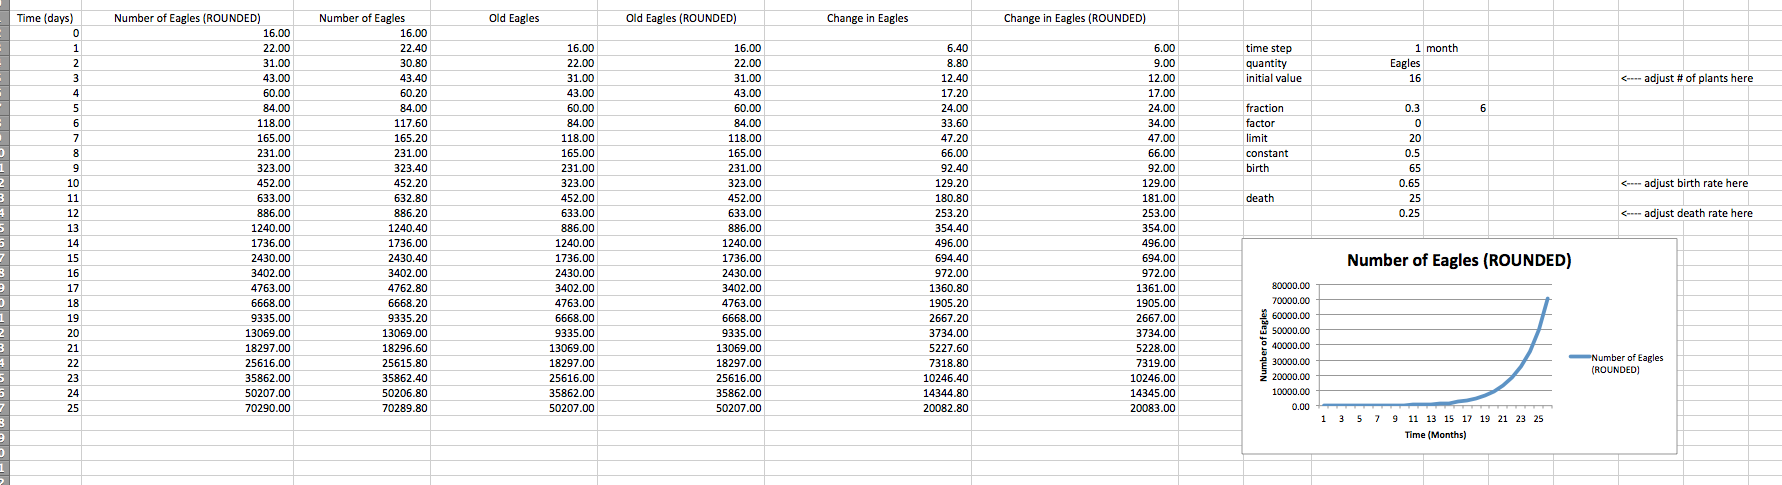
Excel
Our Excel model for this project contains models for plants, grasshoppers, sparrows, and eagles. The plants are at the lowest level of the food chain, and for greater ease of demonstration. The grasshoppers are on the next level of the food chain. The sparrows are above the grasshoppers on the food chain. The eagles are the on the highest level of the food chain. For the purpose of our demonstration, as well as ease of access, we enabled the initial number of plants along with the plant’s rate of reproduction to be adjustable through the use of scrollbars included in the Excel document. The model was made in Excel 2011 and is also confirmed to work in Excel 2008. The data can also be viewed in Google Sheets, albeit not as effectively, as Google Sheets does not support the use of scrollbars nor does it support the use of graphs.
The pros of Excel are that it is practical, easy to use, and widely available. AgentCubes cannot even compete when it comes to the way that Excel is widely available because most people either have Excel or know how to use it. However, Excel does not have a lot of the features that Vensim and AgentCubes have.