Project Authors:
- Nick Gardner
- Brandon Emons
- Israfil Brandon
The Vensim Model
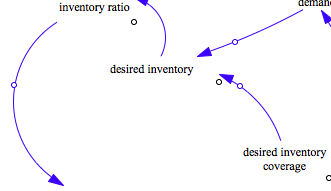
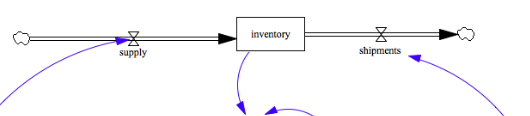
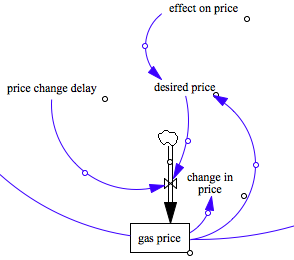
This is our Vensim Model.
This is a supply/demand model with price added in. The goal of this model is to figure out the variables involved and determine how each variable factors into other variables.
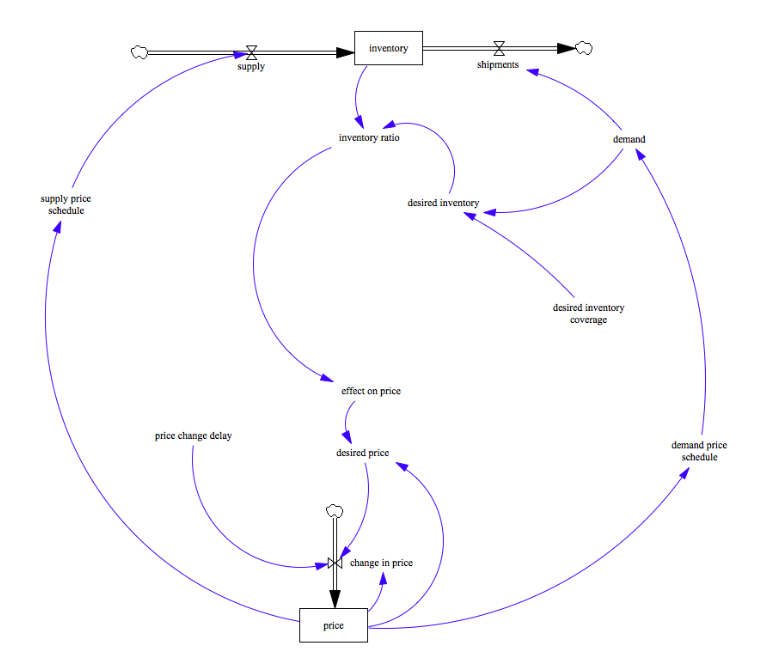
A few variables:
Variables in this section:
Variables in this section:
Variables in this section:
Vensim is a very useful modeling tool but there are some downsides. The graphs in Vensim are not very useful and are a pain to create. You can clearly tell that Vensim is mainly for determining the variables and which variable effects what. Compared to Excel, Vensim is not as useful for numbers.
The Excel Model
This is our Excel model.
The Excel model was very useful for determining the exact numbers that deal with the oil supply. It also visualizes the data very well with the graph. Our Excel model uses a "HAVE HAD CHANGE" model where you take what you have and compare that to what you had to get the change. In our case what we HAVE is new gallons of oil, what we HAD was old gallons of oil, and the CHANGE is the difference between the timesteps. This model is more like our AgentCubes Online model which has oil collectors than it is compared to our Vensim model which is more for comparing the price of gas. There are many positives and negatives to Excel. One of the major positives of Excel is how well it can display numbers. I found the Excel model very useful when it came to determining exact numbers. A downside to Excel as a modeling tool would be how it visualizes data. While Excel does a really good job with showing the data in graphs and charts, compared to the other two modeling tools it is lacking in the visual aspect. Overall Excel is a very useful tool and I expect to be using it a lot more in the future.
The AgentCubes Online Model
This is our AgentCubes Online model.
Our AgentCubes Online model has three agents. An oil collector, an oil buyer, and the background. The orange background represents the oil. The blue oil collectors go around picking up the orange squares and sell them to the blue oil collectors. AgentCubes Online is a very useful modeling tool but it has some downsides. AgentCubes Online has a very odd way of creating graphs and it also does not show off the numbers very well. The major upside of AgentCubes Online is the visual aspect of it. Not many modeling tools have as good of a visual representation as AgentCubes Online.