Interactivate


InteGreat


Shodor > Interactivate > Lessons > InteGreat

Abstract

The following lesson is designed to introduce students to definite integrals through limits and Riemann sums. This lesson is best implemented in groups of 2-3 students.

Objectives

Upon completion of this lesson, students will:

  • understand the use of rectangle and trapezoid sums to approximate area under a curve
  • understand the geometric logic of taking limits of sums
  • understand the geometric logic of integration
  • be able to compare the different methods of curve summation

Standards Addressed:

Student Prerequisites

  • Algebraic: Students should be able to:
    • work with equations more complicated than polynomials
  • Geometric: Students should be able to:
    • graph algebraic equations on a coordinate plane
    • find the area of rectangles and trapezoids
  • Pre-Calculus: Students should be able to:
    • understand the concept of infinity
    • understand and evaluate limits

Teacher Preparation

  • Access to a browser
  • Pencil and calculator
  • Copies of supplemental materials:

Key Terms

areaThe number of square units needed to cover a surface
averageIt is better to avoid this sometimes vague term. It usually refers to the (arithmetic) mean, but it can also signify the median, the mode, the geometric mean, and weighted mean, among other things
infinityGreater than any fixed counting number, or extending forever. No matter how large a number one thinks of, infinity is larger than it. Infinity has no limits

Lesson Outline

  1. Focus and Review

    Conduct a review of limits, infinity, and derivatives to prepare students for the upcoming lesson.

    Ask the following questions:

    • What does it mean to take the limit of a function?
    • Often, at a certain point a function will approach or . Can we sometimes still find the limit? How?
    • How can we find the area under a line, such as ?
    • How do we use limits to find the tangent line or derivative of a function?

  2. Objectives

    Let the students know what it is they will be doing and learning today. Say something like this:

    • Today, class, we are going to learn how to find the area under a curve using rectangles and trapezoids. We are going to be working with computers, but please do not turn on your computers just yet. I want to show you something first.

  3. Teacher Input

    Ask students to calculate the area of a triangle with length 5 and height 5. Then, open Graphit and graph the line y = x. Ask the following questions:

    • How could we calculate the area between the function and the x-axis from 0 to 5?
    • Could we use the same sort of triangle to calculate the area under the function from 0 to 10?
    • What shape would the area under the line be from 5 to 10?
    • Can we find the area under any straight line with a trapezoid?

    Next, graph the line y = x^2. Ask the following questions:

    • Can anyone think of a shape for the area under this curve from 0 to 5?
    • As we said earlier, the area under a line segment is a trapezoid. Given that, is there any way we could divide this curve into a lot of little line segments to find its area?

  4. Guided Practice

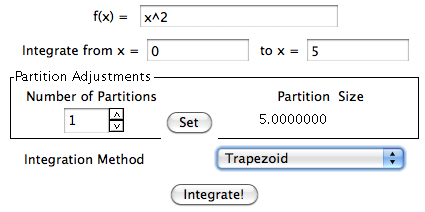
    Open InteGreat and change the settings to the following:

    • f(x) = x^2
    • Integrate from 0 to 5
    • Number of Partitions: 1
    • Integration Method: Trapezoid

    Ask the following questions:

    • Is this straight line a very good approximation of y = x^2 from 0 to 5?
    • [increase the number of partitions to 3] Are these lines a better approximation of y = x^2 from 0 to 5? How can you tell?
    • What do you think will happen if I increase the number of partitions to 10 or more?
    • How could we calculate the area under this curve using these lines?
    • When we worked with derivatives, we said that any curve looks like a straight line if you look at a sufficiently small part of it. Therefore, what would happen to our approximation of the area under the curve as we get more and more line segments, each of which is smaller and smaller?

    Change the integration method to Left Sum, reduce the partitions to 3-5, and ask the following questions:

    • Since it's much easier to calculate the area of rectangles than trapezoids, could we use these rectangles instead to calculate the area under the curve?
    • [increase the number of partitions to 10] Just looking at it, what can you say about the difference between this method and an equal number of trapezoidal partitions?

  5. Independent Practice

    Have students work individually or in groups to complete the worksheet. As they do so, ask students to think about the relative merits of the various summation methods.

  6. Closure

    Bring the class back together and discuss what has been learned. Ask the following questions:

    • Visually, which method of summation seemed to most closely approximate the true value of the function? Why do you think that is?
    • Based on the results of your worksheet, what do you think the area of sin(x) is from 0 to pi?
    • We know from calculus that the exact area of sin(x) from 0 to pi is 2. Which rule gave a sum that was closest to this value at 10 partitions?
    • What about at 50 partitions?
    • How did the error of the various sum types change as the number of partitions increased? Why is that?
    • What do you think would happen as the number of partitions increased towards infinity?

Alternate Outline

This lesson plan can be rearranged in a number of ways:

  • If only one computer is available, complete the worksheet as a class, allowing student volunteers to complete each section.
  • If time permits, the teacher may wish to introduce the concept of negative integrals by looking at equations that dip below the x-axis.


a resource from CSERD, a pathway portal of NSDL NSDL CSERD