Impossible Graphs
|
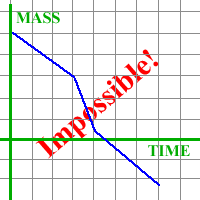
Student: What does it mean for a graph to be impossible? After all, it is just an abstract picture. Mentor: A graph is an abstract picture which represents something in reality so a graph cannot represent something in reality which cannot exist or happen. For example the following graph would be impossible because it shows negative mass:

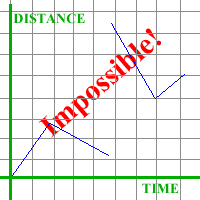
Student 1: I can make another graph that would be impossible for many situations in the real world. If there is a graph of distance vs. time, it can't have gaps because time is continuous. This graph shows breaks in time:

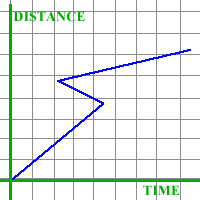
Mentor: That's true! We can distinguish between continuous graph which you could draw without ever lifting your pencil, and a discontinuous graph which may have gaps, as long as it has one and only one y-value for each x-value. Can you tell me why this graph is impossible?

Student: Because the graph shows time moving backwards.. Mentor: Exactly. As you can see, to decide whether each graph is possible or not, we mostly need common sense. Student: It also helps to know the laws! Mentor: That's true. Knowing the laws could never hurt. |
