From Graphs to Function Machines and Back
|
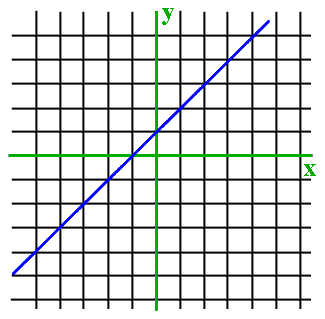
Mentor: Function machines involve an input value and an output value. I have a function machine without a formula or a description. There is something else here that is supposed to tell me how the machine works. It looks like a line on a grid. If you give me a number to put into the machine, I will use this line as my function machine to find out what number comes out.

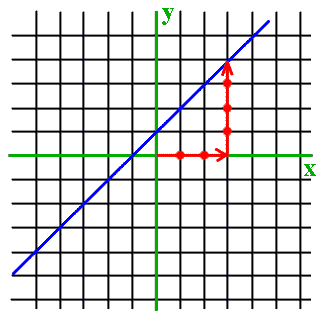
Student: Use 3 as input. Mentor: My pleasure. I just count 3 steps to the right from zero. Then I go vertically (straight up or down) up to the line, counting steps. Here, I go up: One, two, three, four steps. 4 is the number that this function produces out of 3!

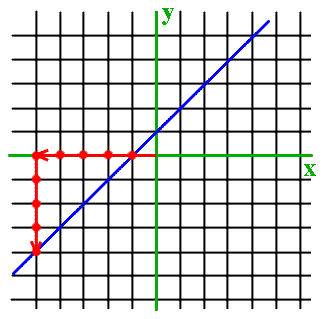
Student 1: Can I try it? I want to put 1 into the function machine. I start from zero, make one step to the right, then go straight up counting the steps: One, two. So the function produces 2 when you put 1 into it! Student 2: Do you ever go to the left of zero? Mentor: Sure. The numbers for steps to the left of zero are called negative numbers. We put a small minus sign in front of a number to show that it is to the left of zero, or negative. Likewise, we use a minus sign to mean "down." Who wants to try the machine on negative numbers? Student: I want to put -5 into the machine. I go five steps to the left from zero, then up... no wait, down to the line: One, two, three, four steps down. Mentor: So the function produces -4 when the input is -5.

Student: I know exactly what the machine does! It adds 1 to the input numbers. Mentor: The line told you that! This line, called a graph, is just another way of explaining what the function does. Would you like to try another "line-as-machine-instruction"? Student: Of course! Mentor: Let us now start from formulas, and build graphs from them. For simpler formulas, computers can draw graphs very well, but you may want to know how to draw one yourself. You do not have to learn to do it as quickly as a computer can, but the general idea will help you understand other concepts, such as topics from statistics or calculus. I would like to have a function that tells us the area of the square, Y, when we know the length of its side, X. How are X and Y connected? Student 1: The area is the length of the side squared. Student 2: Yes, Y is X times itself. Mentor: And who wants to tell me how it will look when written as a formula? Student: "Y is X squared" translates into: Y=X 2 Mentor: Now we can transform the formula into the graph. We will use negative numbers too. Of course, a square with sides of negative length do not exist. But if we just consider the formula, we can use all real numbers. We can start by drawing just a few points, and see if there is a pattern on the plane. We pick any numbers we want for X, find the appropriate Y, and then go from 0, "walking" X units left or right, and then Y units up or down. So, let's look at some numbers! Student 1: We can write the X's we select, and Y's we get from the formula, right next to each other:
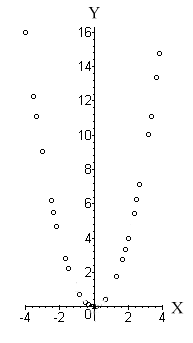
Student 2: I will draw the pairs on the coordinate plane. The first one is 2 and 4. We start from 0 and go 2 steps to the right, 4 up, and here we have the point. And so on with more points. Mentor: We need to put enough points on the plane to see a pattern and guess what happens in-between the points we have. Student: It takes a long time! Here are some points:

Mentor: Now if we draw a graph dot by dot, we can use it to predict the values of Y by the values of X. It should work just as well as the formula. Student: Let's see. Suppose I want to find Y for X=2.5. I go 2.5 units to the right, and then up to the graph... It is a little more than 6. Mentor: What value does the formula give you for Y? Student: 2.5 2 = 6.25 That is what the graph shows. Mentor: There are two ways of doing it faster. One way is to learn general laws that will help you draw functions using just a few critical points and by learning a little about how functions behave. Advanced algebra and calculus study these methods. Another way is to use a computer or a calculator to do the tedious job of finding coordinates, drawing points, and then connecting them. Let us make several more graphs of functions. |
