Who Spread the Flu?
Case Facts:
The week after Spring Break all 500 students and teachers at Contagious High School in Contagious, Maryland went home sick with influenza (the flu). It has been discovered that three students came back after Spring Break, each had a different infectious flu. The rates at which each of the flus can infect another person (Infection Rate) and the rates at which a person with the flu gets better (Recovery Rate) are commonly known for each of these strains. You have been asked to determine which of the three originally infected students was the source of the flu that was so virulent it affected nearly everyone in the school.
| Student Name | Flu Strain | Infection Rate | Recovery Rate |
|---|---|---|---|
| Bobby Getwels | Ick Flu | .002 | .5 |
| Amess Besick | Plu Flu | .001 | .5 |
| Majorly Ruddy | Gacky Flu | .08 | .2 |
Which student had the flu that caused everyone to get sick?
Approximately how many students would be infected by Bobby Getwels if he was the only source of
infection? by Amess Besick?
What is the relationship between the recovery rate and the shape of the line for 'recovered'?
What is the relationship between the infection fate and the shape of the line for 'infected'?
Can you predict which flu will infect more people: one with an Infection rate of .001 or .002?
Parallel Example
Before building the model for this case, consider this case study:
Source:
Mathematical Biology, J.D. Murray, Springer-Verlag, 1989.
Background:
In 1978, a study was conducted and reported in the British Medical Journal (4 March 1978) of an outbreak of the influenza virus in a boys boarding school. The school had a population of 763 boys. Of these 512 were confined to bed during the epidemic, which lasted from 22 January until 4 February. It seems that one infected boy initiated the epidemic. At the outbreak of the epidemic, none of the boys had previously had influenza, so no resistance to the infection was present.
Modeling Task
Build a computational model of this epidemic, looking to answer these two questions:
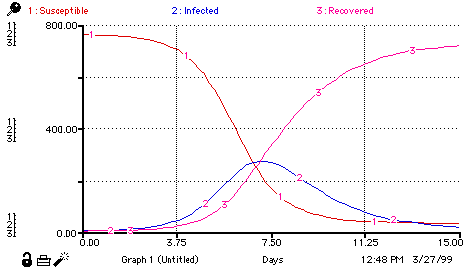
- On what day (with Day 0 being the beginning of the epidemic) did the majority of the boys have the flu?
- At what time did most or all of the boys recover from the illness?
To build this model, you should use the 1927 Kermack-McKendrick model known as the SIR algorithm.
This algorithm looks at the change in three populations: susceptibles (S), infecteds (I), and
recovereds (R). It assumes that once recovered, immunity from recontamination exists and therefore
a patient cannot re-enter the susceptible or infected group. The algorithm is shown below in
differential equation form:
dI/dt = rSI - aI
dR/dt = aI
Once you have built your model, show the three populations on your graph. You might also consider using a "Total Population" converter to ensure that all 763 boys are accounted for at all times.
Extension:
What would happen if some of the boys had been vaccinated prior to the beginning of the epidemic? Let's assume that 10% of the susceptible boys are vaccinated each day -- some of them getting the shot while the epidemic is happening in order not to get sick (this assumes, falsely, that instant immunity is realized once you've received the shot). Experiment with the 10% vaccination rate to determine how it changes the intensity and duration of the epidemic.
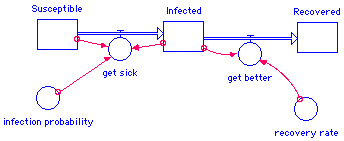
The completed model should look like this:

Equations are:
Infected(t) = Infected(t - dt) + (get_sick - get_better) * dt
INIT Infected = 1
INFLOWS:
get_sick = infection_probability*Susceptible*Infected
OUTFLOWS:
get_better = recovery_rate*Infected
Recovered(t) = Recovered(t - dt) + (get_better) * dt
INIT Recovered = 0
INFLOWS:
get_better = recovery_rate*Infected
Susceptible(t) = Susceptible(t - dt) + (- get_sick) * dt
INIT Susceptible = 762
OUTFLOWS:
get_sick = infection_probability*Susceptible*Infected
infection_probability = 0.00218
recovery_rate = 1/2
Results graph:

Online Flu Model
(Note: In addition to changing the infection and recovery rates in the model, you may also need to change the number of infected and susceptible people.)