Computational Chemistry Lab: The Bohr Atom
Objective
In this lab activity, you will be using the spreadsheet to calculate the energy levels, frequencies, and wavelengths of electrons in orbits. The question is: how can we observe transitions (movement) of electrons from an excited state to a ground state? We are also interested in knowing: which series can we see?
Background
In chemistry, we are interested in the movement of electrons in orbit around the nucleus of an atom. The electron normally occupies the level closest to the nucleus. In this level the energy of the electron is at its lowest; this state, with a principle quantum number (n) equal to 1, is commonly called the ground state.
Atoms can absorb energy through their electron structures in the form of energy packet (or "quanta") called a photon. When this energy packet is absorbed, the electron in orbit around the nucleus move to a higher (more distant) level. This level is called the excited state. Naturally, the electron cannot remain at this excited state for a very long time (it stays there for about 10-8 seconds, or for .00000001 seconds). When the electron "falls" back to the ground state level, energy is released. Depending on the wavelength of this fall, you might be able to see the energy released in the form of color (ie, a burst of light). Any energy with a wavelength between 380 and 750 nanometers (nm) will be visible to most people.
Your objective in this lab is to create a spreadsheet that will allow you to calculate the change in energy, the frequency, and the wavelength when an electron moves from an excited state to a ground state. You will be asked to use the full electromagnetic spectrum to predict which part of the spectrum appears for several different energy levels.
The equations you will need to model are as follows:
- Energy of the electron in a level (energy has units of Joules, J)

where RHis the Rydberg constant, with a value of 2.18 x 10⁻¹⁸ J.
- Change in energy

- Frequency (in units of "per second", or /s, or s-1)

where h is Planck's constant, with a value of 6.63 x 10⁻³⁴
- Wavelength (in nanometers)

where c is the speed of light, with a value of 3.00 x 10⁸ meters per second (m/s).
Don't forget to convert this to nanometers per second!
Electromagnetic Spectrum
| Wavelength Range (nm)� | Radiation Produced |
| Less than 185 | X-rays |
| 185-380 | Ultraviolet |
| 380-450 | Violet |
| 450-495 | Blue |
| 495-550 | Green |
| 550-570 | Yellow-Green |
| 570-590 | Yellow |
| 590-620 | Orange |
| 620-750 | Red |
| 750-1900 | Near Infrared |
| 1900-2500 | Infrared |
| Above 2500 | Microwaves, radiowaves |
Case Study Instructions
- Your spreadsheet should include the following items:
- appropriate titles
- a "constants" section, showing the three constants (WITH LABELS!)
- the initial n and the final n for each series
- calculated value of the initial energy
- calculated value of the final energy
- calculated value of delta-E (delta is a Greek letter, it looks like a triangle)
- calculated value of frequency for the energy (photon) emitted with that delta-E (on the Macintosh, use Option-J to make the delta symbol).
- calculated value of wavelength
- radiation produced, based on the wavelength of the emitted energy
Hint: use the "fill" command to save yourself typing! Work smarter, not harder.
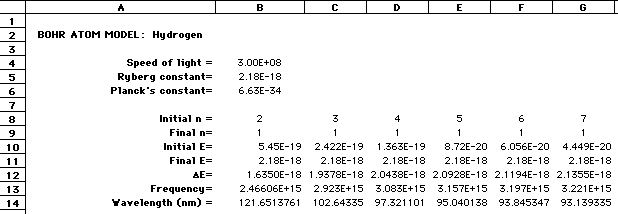
Sample Spreadsheet:

Historical note: transitions from n=7,6,5,4,...2 to 1 are known at the Lyman series. Other named series are:
- Balmer series: transitions to n=2
- Paschen Series: transitions to n=3
- Brackett Series: transitions to n=4
- Pfund: transitions to n=5
- Humphreys: transitions to n=6
[Glossary][CompChem Main Page][HTML Labs]
To Slides:[1]
[2]
[3]
[4]
[5]
[6]
[7]
[8]
[9]
[10]
[11]
[12]
[13]
[14]
[15]
[16]
[17]
[18]
[19]
[20]
[21]
[22]
[23]
[24]
[25]
[26]
[27]
[28]
[29]
[30]
[31]
[32]
[33]
[34]
Developed by
 The Shodor
Education Foundation, Inc.
Copyright © 1998
Last Modified:
Questions or comments about this page should be directed to gotwals@shodor.org


 The Shodor
Education Foundation, Inc.