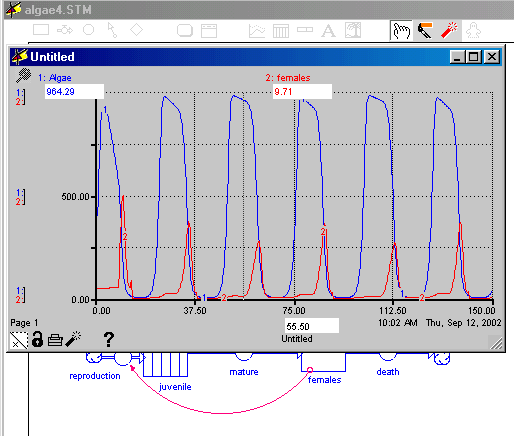
If you click on the graph, numbers appear under algae, females, and replacing days. As you slide the cursor over the graph you can watch the values change.

16. What are the maximum and minimum values for the algae and daphnia?
17. If the daphnia drop this low how can they increase again?
Double click on the table 1 icon. This opens up a table of the runs data. Moving the scroll bar up and down allows you to examine the entire run's data. This table also gives the number of juveniles.
18. What are the minimum and maximum values for the juveniles? Describe how the female and juvenile numbers change relative to each other.
The model you have been using simulates a pond with plenty of nutrients. This would simulate a pond in a forest or wetlands. The algae can grow at their maximum rate, doubling every day. You can change the model to simulate a pond in town next to a parking lot. In your city pond, there will be fewer nutrients. Fewer nutrients will reduce the algae's maximum "growth rate." The maximum number of algae will also be reduced.
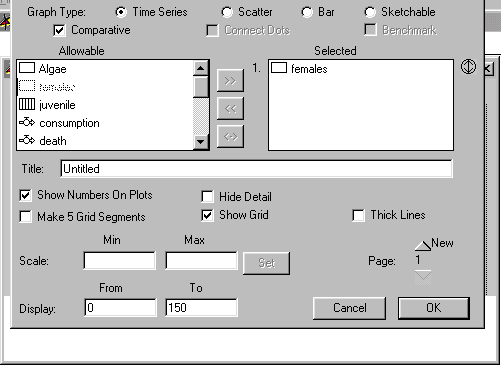
If you want to compare the two ponds, STELLA will help you do that. Open a new graph by clicking on the pink graph pad in the tool bar. Clicking on a blank place on the screen will open the graph pad. Double click on the graph to open its editing mode. Click the "Comparative" box. Double click the females to select it.

Run the model again to record the female values.
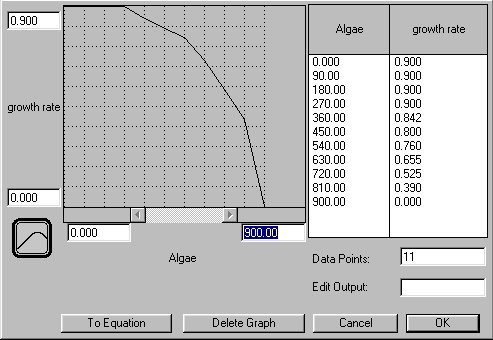
Open the growth rate converter by double clicking on it. Change the maximum number of Algae from 1000 to 900.00 and hit enter. That changes all of the values in the Algae column. Next change the maximum growth rate from 1.000 to 0.900. Change the first 4 values for growth rate to 0.900.

Run the model again.
19. Describe the change in the daphnia values in the two ponds.
You can make more changes to the growth rate and see what effect it has.