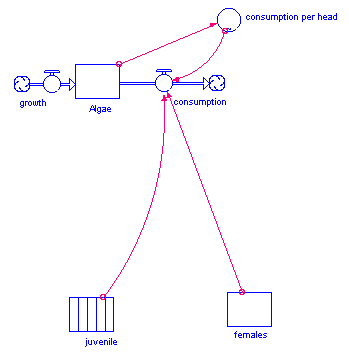
To better understand the model we will look at its parts.

In our model each "algae" represents 1,000 algae. We start with 210 algae in the model.
2. How many algae does this represent in our aquarium tank?
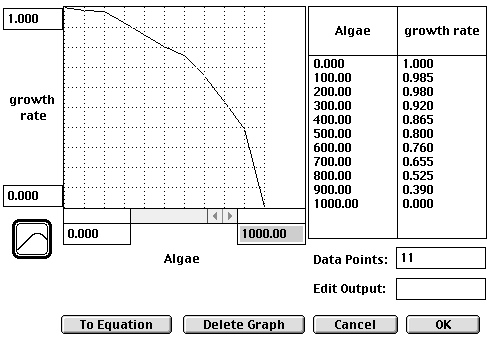
When there are only a few algae, all the algae reproduce. The algae double in number every day. As the population increases more stop reproducing. Why? Because some algae are in the shade and don't get enough light. The nutrients are also in limited supply. There aren't enough minerals and nitrates for a large population.
If you double click on the growth rate converter a graph will appear. This graph shows how the population affects the growth rate.
The population is the input.
The growth rate is the output

3. Is the growth rate function linear or nonlinear?
4. As the number of algae increases, what happens to the growth rate?
A. it increases
B. it decreases
C. it doesn't change.
5. Is the slope of the graph positive or negative?
6. Next week some students decide to close the blinds. How would this change the growth rate? Explain your answer.
Algae reproduction is the product of the number of algae and the algae growth rate.
Algae * growth_rate
In our model the number of algae can be reduced when daphnia eat them.
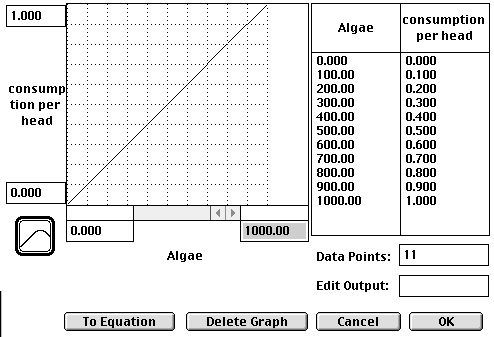
This relationship is represented by the consumption per head function. Double clicking on the consumption per head converter will open this graph.

7. Is this relationship linear or nonlinear?
8. As the number of algae increases from 0 to 1000 what happened to the number eaten by each daphnia?
The number of algae consumed is the product of the number of daphnia and the consumption per head:
(daphnia + juvenile * .3) * consumption_per_head
9. Why are the number of juveniles multiplied by .3 and not 1?

