Exploring the Relationship Between Mass and Volume

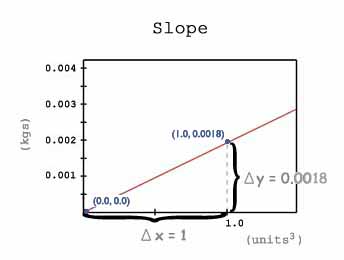
Look at the graph to the right. It is a close-up view of the graph of the equation y=0.0018*x. From the point (0, 0) to the point (1.0, 0.0018), the change in x is 1 and the change in y is 0.0018. To find our slope, we divide y by x. So, y/x = 0.0018/1.0 = 0.0018.
Remember the equation we mentioned on the formulas page? It was y= mx + b. "m" is the number that we've been changing, or the slope. Have you noticed that when you make "m" really large the line gets steeper?
This change occurs because "m" represents the change in the y-value everytime the x-value increases by one. So, for our equation y= 0.0018*x, every time the mass (x) increases by 1, the volume (y) increases by 0.0018. Check this with your graph. Multiply your slope (0.0018) times a mass and see if its close to the actual volume.
Once you find the best fit for the value of m in y= mx + b, check that this value is appropriate. Put in a value for x, any volume value. Then plug it into the equation to find y. Is y close to your corresponding value of mass? If it is not, check to see if there is a better m value and repeat the process.