Page 5
Optimize Surface Area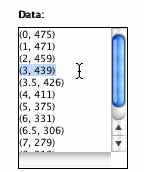
To consider optimizing surface area, let's graph Cut vs. Surface Area. Open the Data Flyer again, but this time use the cut as the first number of the ordered pair and the surface area as the second. For example the cut of 3 has the surface area of 439 units squared. The ordered pair for these values would be (3, 439). Enter in the rest of the values.
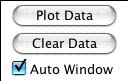
Click "Auto Window" and then "Plot Data." What is the shape of the graph? Surface area is represented by the y-values. Where is the y-value (the surface area value) the highest, or the maximum? Does it make sense?
Cut vs. Surface Area
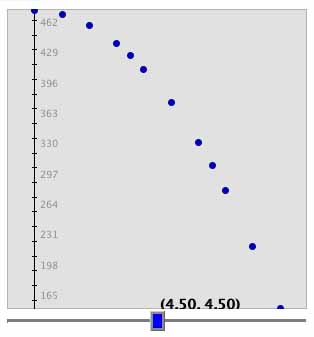
Let's find a good model to fit this graph. Would a line best fit the data? The data seems to curve. So a line would not be the best fit.
How did we find the values for surface area? If you recall, from page 1 we counted all the squares that were not cut out into tabs. There is a formula to find this number. We will use this formula to plot our data.
| Surface Area Formula! |

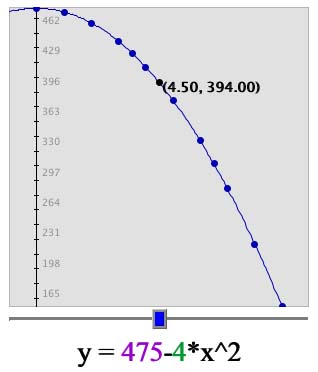
Now, enter in the formula y=475-4*x^2 and click "Set Function. How does this curve fit the data?
Cut vs. Surface Area
| Auto Window | Zoomed Out |
 |
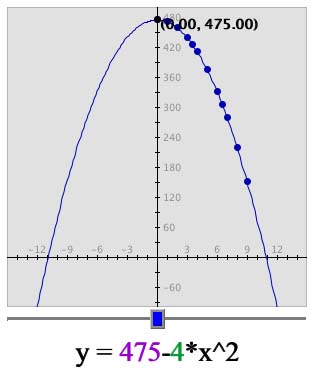 |
Notice how the graph curves and is not in a straight
line. This curve is because in the equation we have x2
and not just x. 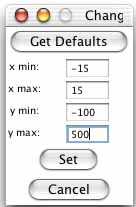 We call this
 curve a parabola. It is easier
to see when you zoom out. To see this on your graph click on "Set
Window." Then change "x min:" to -15, "x max:" to 15, "y min:" to
-100, and "y max:" to 500. Then click "Set."
curve a parabola. It is easier
to see when you zoom out. To see this on your graph click on "Set
Window." Then change "x min:" to -15, "x max:" to 15, "y min:" to
-100, and "y max:" to 500. Then click "Set."
Remember the formula that we used for the surface area? It was SA= 475 - 4x2. What happens when x increases? The answer is that the surface area decreases. Therefore the lower the cut, the higher the surface area, which explains why the graph curves down. Therefore, surface area is optimized with a low cut.
| On to Page 6! |