Quick Guide to Atom in a Box


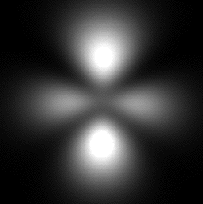
Atom in a Box is designed to allow the user to directly visualize electron clouds from the three dimensional wavefunction equations. The graphical display will show the wavefunction in three dimensions, rotate it, generate slices, and more. In this course, you may use this tool to gain a better understanding of the structure and meaning of wavefunctions and electron clouds.
When you open Atom in a Box, it automatically brings up a 3d orbital. You can identify the orbital by its shape as well as the label in the upper line of the dialog box. The orbital is identified by quantum numbers n, l, and m. A "name" is given next to the values of these quantum numbers. See Slide 25 for a description of quantum numbers.
The user can change the orbital in the "box" by using the plus and minus signs above and below the three quantum numbers or by changing the n,l,m options on the menu bar.
Orbitals in the display can be rotated by clicking and dragging on the orbital image or the x,y,z axes. If the orbital is still moving when you release it, it will continue to rotate. The motion can be stopped by pressing the space bar.
Using the "Display" option of the menu bar, under View, you can change the display to include color. The "phase" of the wavefunction is used to denote the color. Phase has to do with the complex portions of the wavefunction. Also, 3-d options are included. Bring your own glasses! Note: this option has a tendency to create headaches, use it judiciously.
Also under "Display" is the Background Sound option. You can turn on the sound option as long as it does not bother anyone. If asked, please turn it off right away! The sound can be very annoying after a while. Let the orbital rotate and listen to the sound as it does. The sound functions almost as an audio-output oscilloscope. Try listening to a few different orbitals if the sound doesn't bother you!
If you click on the slice tab on the bottom of the dialog box, it opens another dialog allowing you to slice vertically and horizontally through the orbital currently displayed. The orbital can be changed as before. The "slice" is shown on the right of the screen with the orbital on the left. To move the location of the slice, simply click and drag on the frame around the orbital. Clicking on the top or bottom of the frame results in a vertical slice, while the sides give a horizontal slice. To change the depth of the slice, click and drag on the white bar dividing the two sections of the dialog box. It is displayed as a road fading away to the horizion; when the pointers are at the bottom, the slice is nearest to you, and then moves away.
The spectrum tab at the bottom of the dialog box gives you access to another box where you can specify a transition from one quantum state to another and see the resultant emission of energy. A line on the spectrum to the right is highlighted when you select a transition corresponding to that line.
 The Shodor
Education Foundation, Inc.