Case Studies and Project Ideas: Windkessel Cardio


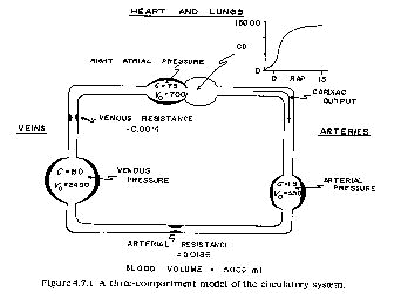
In the equations that follow, P, F, and V represent pressure (mmHg), flow (ml/min), and volume (ml), respectively. C is compliance (ml mm/Hg), Vo is unstressed volume (ml), and R is resistance (mmHg min/ml).
Flow through a blood vessel is determined by two factors: 1) the pressure difference between the two ends of the vessel, called "pressure gradient," which is the force that pushes the blood through the vessel, and 2) the impediment to blood flow through the vessel, which is called vascular resistance.
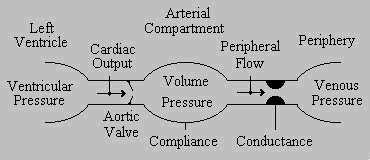
This Windkessel model consists of four components:
The independent variable is time (t). The units are minutes.
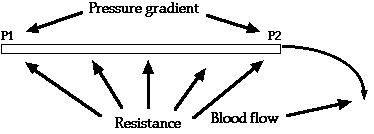
P1 represents the pressure at the origin of the vessel; at the other end the pressure is P2. Resistance to flow occurs as a result of friction all along the inside of the vessel. The flow through the vessel can be calculated by the following formula, which is called Ohm's law:

| Q is blood flow |
| P is the pressure difference (P1-P2) between the two ends of the vessel |
| R is the resistance |
This formula states that the blood flow is directly proportional to the pressure difference but inversely proportional to the resistance. That means that the pressure of both ends of the vessel are different and that determines the rate of flow. For instance, if the both ends of the segment were 100 mm-Hg pressure and yet no difference existed between the two ends, there would be no flow despite the presence of 100 mm-Hg pressure.
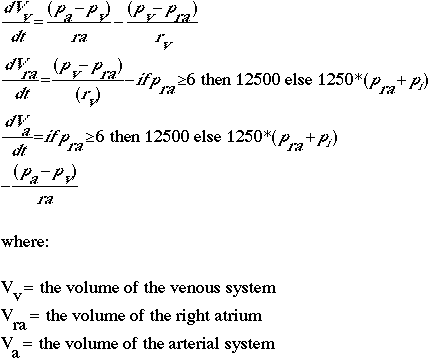
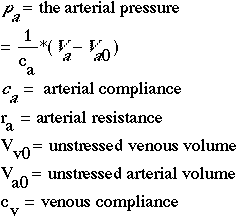
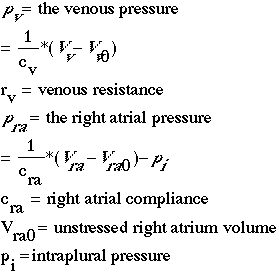
Initial values for this model:
Arterial volume = 1000 mL
Right atrial volume = 1000 mL
Venous volume = 3000 mL
Arterial compliance = 1.5 mL mm-Hg
Arterial resistance = 0.0186
Intrapleural pressure = 4 mm-Hg
Right atrial compliance = 75 mm-Hg
Unstressed arterial volume = 350 mL
Unstressed right atrial volume = 700 mL
Unstressed venous volume = 2450 mL
Venous compliance = 150 mm-Hg
Venous resistance = 0.0014
You should run this model for 1 minute, using very small step sizes (0.01 is recommended). You should also use RK4 integrator. We are fundamentally interested in the amount of cardiac output coming out of the arteries.
 The Shodor
Education Foundation, Inc.