Case Studies and Project Ideas: Pharmacokinetics - One Compartment


In looking at a one compartment model, we employ a mass balance approach to the problem. Mass balance is the term used to indicate that we are interested in conserving the mass of the substance, i.e., accounting for all the mass at all times. For a one compartment model, the mass balance equation is as follows:
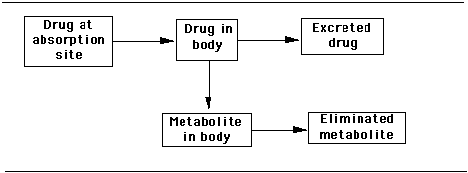
At its most simplistic level, the model can be represented by the graphic:
Figure 1.

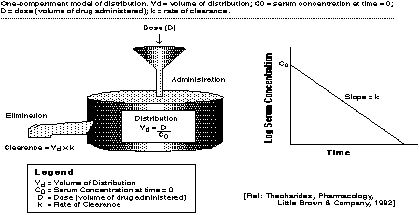
Another graphic to illustrate this model is as follows:
Figure 2.

In this mass balance model, the rates of change -- the flow of the drug through the model -- must be equal to zero according to the following equation:
In any study of pharmacokinetics -- the quantitation of the time course of a drug and its metabolites in the body -- these two components of the mass balance system are typically employed. More complex models are often variations on this theme.
In addition to the concepts of absorption, elimination, and metabolism, several other parameters play an important role in most pharmacokinetic models. As shown graphically below, the value of the volume of distribution is key. The volume of distribution, calculated here by dividing the dosage by the concentration in the body at the start of the simulation, is defined several ways. Generally, it is defined as the apparent volume into which a drug distributes in the body at equilibrium. Volume of distribution is typically measured in liters (L). Volume of distribution is a direct measure of the extent of distribution, although it rarely corresponds to a real volume. The values for volume of distribution for individual drugs can often be found in the literature. Digoxin, for example, has a volume of distribution of around 500 liters for a normal 70 kg adult.
Another important concept is that of clearance. Clearance is probably the most useful parameter for the evaluation of an elimination mechanism. Defined, clearance is a proportionality factor relating rate of drug elimination to the plasma/drug concentration. In the graphic below, the clearance is calculated by the rate of clearance times the volume of distribution. The unit for clearance is volume per unit time. For example, if the clearance value is 1 L/hr, then at a concentration of 1 mg/L, the rate of drug elimination is 1 mg/hr. There are a number of ways of estimating clearance -- for this case study, values of clearance will be provided. You might choose to vary these values to investigate their effect on the compartment!
Both volume of distribution and clearance can be related to each other through the term of half-life. Half-life is that period of time when one-half of the substance has been removed through some mechanism. Mathematically, pharmacokinetic half-life can be defined as:

It should be noted that a half-life reflects rather than controls the volume of distribution and the clearance, both of which are independent variables.
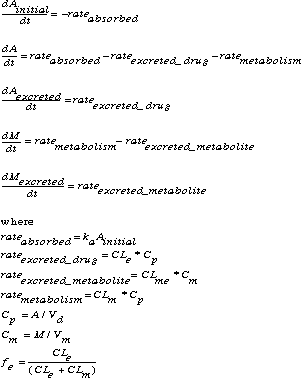
Figure 3.

In this model, following the graphic in Figure 2, we are interested in the concentrations of drug in one-compartment, but at five different levels:
Each of the arrows in the graphic suggest the flow of mass from one area to the next. The arrows represent the rates of mass transfer between sections of the model.
The algorithm for this particular model is outlined below. Using these algorithms and these initial values, your task is to build this model and then use it to investigate a number of scenarios, described in the section below.
Initial values: Initial A = 0 mg/L if the dosing route is oral, 200 mg/L if the dosing route is IV (note: you should consider using the IF...THEN....ELSE built-in functions to include this feature)
Initial Ainitial = 200 mg/L if the dosing route is oral, 0 mg/L if the dosing route is IV
Inital M = 0 mg/L
Initial Mexcreted = 0 mg/L
Excreted clearance (CLe): 2.5 L/hr
Metabolized clearance (CLm): 3.5 L/hr
Excreted metabolite clearance (CLme): 12.8 L/hr
ka = 0.5
Volume of distribution (Vd) = 32 L
Volume of distribution of the metabolite (Vm) = 24 L
Simulation time: 48 hours in 15 minute intervals (dt = 0.25 hour)
In your model, you should also calculate the log (base 10) of the concentration of the drug in the plasma and the log of the concentration of the metabolite.
Once your model is completed, build a graph plotting all of the stocks (Ai, A, M, Ae, and Me). You should also plot logCp and logCm on the same graph as a function of time.

 The Shodor
Education Foundation, Inc.