Case Studies and Project Ideas: Bubonic Plague


NOTE: This case studies assumes that you have built at least one of the basic epidemiology models, such as the flu epidemic model using the SIR algorithm. This case study does not review that model, and assumes that you remember how that model was built (or that you can go back and review it before starting this model!).
In all three types of plague, the fatality rate is quite high if untreated, around 50%. The disease is caused by a bacterium known as Yersinia pestis, or Y. pestis for short. It survives well in warm-blooded animals (such as rats and humans!) and in fleas. The two main vectors, or disease-carrying organisms, are rats and fleas. Humans most typically get the plague by a bite from a plague-infected flea, although it is possible to get the plague from rat bite and from other humans.
The plague, while not as prevalent as it was in the Middle Ages or even in recent years, is still a concern. Between the years 1980 and 1994, there were 18,739 cases of the plague in humans worldwide, with 1,853 deaths. The majority of the cases were in Africa, with Tanzania having the most. In the United States, there were 229 cases with 33 deaths. Most of the cases of the plague in the U.S. happen during the summer months, when the risk of expose to infected fleas is greatest. The majority of these cases are acquired in or near the person's home. The risk is greatest when there is food and shelter available for rats near humans.
Likewise, we have a birth rate of 9%, probably too high for this time in history. Many children died in childbirth (and so did the mothers), and the infant mortality rate was quite high. We have set the birth rate slightly higher than the natural death rate to ensure at least some growth in the population.
Like the basic SIR flu model, people get infected and get better. People getting infected depends on the number of susceptibles, the human infection rate, and the number of infected fleas. Why does it not depend on the number of infected humans or the number of infected rats? In this model, we are assuming (incorrectly) that humans are only infected by being bit by fleas. We make this assumption to make the model a little more manageable.
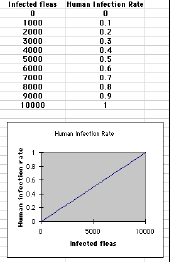
The human infection rate depends on the number of infected fleas there are in the model. Infection rate is a function of infected fleas, and must be represented in STELLA with an input graph. The data and what the graph should look like is shown below:

In this model, the number of humans that die from the disease is computed by the number of infected humans times the disease death rate. The research says that the disease death rate is quite high, so we'll set it at 60% for now.
The number of humans that recover is basically the number that are left after infected people die (either from the disease or from other causes). The algorithm for the flow "humans get better" is:
If the disease death rate is set at 60% (0.60), then 40% (or 1.0- 0.60 = 0.40) of the infected persons recover.
The recovered persons can return to being susceptible. All of the recovered people (at least those that are left after dying from the plague or other causes) go back to susceptibility.
For initial values, use:
| Initial susceptibles = | 999,999 |
| Initial infected humans = | 0 |
| Initial recovered humans = | 0 |
You should also keep track of the total human population (use a converter), which is just the three populations added together!
Susceptible rats are born in litters. Each female has six litters per year, and each litter consists of about eight young rats. This model uses a time unit of days, so we need to convert year to days. The algorithm looks like:
To calculate the number of female rats, we take the average of susceptible rats and infected rats. We are assuming that infected rats can still have litters, although it is unlikely that they live long enough to produce a litter. The number of rats born is simply the number of live rat births per female times the number of female rats.
Susceptible rats become infected. The "rats get infected" flow is calculated by:
We are assuming that the fleas do not infect the rats, only that fleas become infected by biting rats, then infecting humans by biting humans. For an extension to this model, you might experiment with changing the structure of the model to see the effect of fleas infecting the rats. Rat infection rate is initially set at 50%, and is a number with which you might also want to experiment!
Both susceptible and infected rats die from causes other than the plague, at a rate of 20%. In addition, rats die from the plague, at a rate similar to that of humans (60%).
You should keep track of the total rat population just as you did with the humans.
Hint: use a total rat population converter.
| Initial infected rats | 1 |
| Initial susceptible rats | 1000000 (or 1e6) |
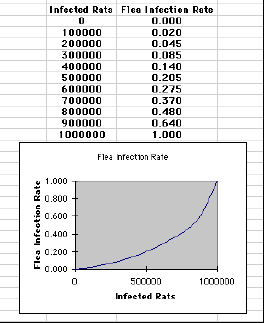
The flea infection rate also depends on the number of infected rats there are, sort of a double-whammy. The chart below shows the numbers and what your graph should look like:

Like the other two groups, fleas die from the plague and from other causes. The flea plague death rate is 60%, and the flea death rate from other causes is 20%.
| Initial number of larval stage fleas: | 0 |
| Initial susceptible fleas: | 1000000 (or 1e6) |
| Initial infected fleas: | 1 |
 The Shodor
Education Foundation, Inc.