Case Studies and Project Ideas: AIDS dynamics

Medicine and the Biosciences Main Page
Other Case Studies and Project Ideas
Source:
Mathematical Biology, J.D. Murray, Springer-Verlag Publishers, London, 1989
NOTE: This model requires above average mathematical skills AND the maturity level to handle sensitive topics!
Goal:
to build a computer model to evaluate the development of an AIDS epidemic in a homosexual population over a period of 30 years.
Assumptions and guidelines:
- Constant immigration of new susceptibles every year.
- Susceptibles can become infectious or (eventually) die a natural death
- Infectious people can either die a natural death, develop full-blown AIDS, or become non-infectious (but still test positive for the HIV virus -- this is known as being "seropositive")
- People with AIDS can die of their disease or die a natural death.
Important factors:
- There is a constant immigration that comes from recruitment of new homosexuals into the population.
- Susceptibles can become infectious based on the probability of acquiring the disease from a sexual partner and from the number of partners per time.
- All populations can die a natural death at a constant rate
- Infectious persons develop AIDS based on the rate of conversion of the HIV virus to AIDS symptoms and the proportion of seropositives who are infectious
- AIDS homosexuals die of AIDS at a constant rate
Building the Model:
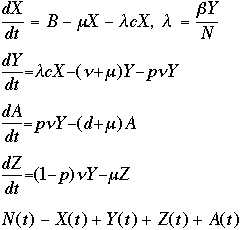
The mathematical equations of this model are represented below in differential equation format. Each of the four populations: susceptibles, infectious, seropositives, and AIDS patients, are the populations we wish to track over the simulation period.
Keep in mind that when you are building your model, a positive value indicates a flow coming INTO a stock, and a negative flow indicates a flow going OUT of a stock. For example, in the differential equation for susceptibles, you will need one flow coming in and two flows going out! Think about this: how does the susceptible population increase? We're assuming that their is only ONE way. How does the susceptible population decrease? There are two ways: what are they?
 The variables above are as follows:
X represents those who are susceptible to getting AIDS
Y represents those who are HIV-positive (infectious, capable of giving the HIV virus)
Z represents those who are seropositive non-infectious (sexually inactive due to their condition)
A represents those with full-blown AIDS
N re represents the total population (you do NOT need to use the differential equation for this population -- you can simply total all four of the populations to ensure that you have everyone accounted for!)
 recruitment rate of susceptibles
 the natural (non-AIDS) death rate
 the probability of acquiring infection from a randomly chosen partner
 , where
  is the transmission probability
c is the number of sexual partners
d is the AIDS-related death rate
p is the proportion of seropositives who are infectious
v is the rate of conversion from infection
A large study of the AIDS epidemic was conducted in the early 1980's in England, with the following data points collected:
| TOTAL number of initial population | 100,000 |
| Initial number of susceptibles | 90,000 |
| Initial number of AIDS-infected persons | 0 |
| Initial number of HIV-positive persons | 10,000 |
| Initial number of seropositive-noninfectious persons | 0 |
| | |
| Recruitment rate | 13,333.3 persons per year |
| AIDS-related death rate | 1.33 per year |
| Rate of conversion from infection | 0.237 |
| Natural death rate | 1/32 (one in 32 persons per year) |
| Number of sexual partners | 48 per year |
| Probability of acquiring AIDS | 30% (0.30) |
| Rho | 5.15 |
NOTE: the transmission probability  is calculated from:
 where: where:  is the transmission probability is the transmission probability |
 (rho) is a constant (rho) is a constant |
| v is the rate of conversion |
| c is the number of partners per year |
Developed by
 The Shodor
Education Foundation, Inc.
Copyright © 2000-2003
Questions or comments about this page should be directed to biomed@shodor.org


 recruitment rate of susceptibles
 the natural (non-AIDS) death rate
 the probability of acquiring infection from a randomly chosen partner
 , where
  is the transmission probability
 is calculated from:
 where:
  is the transmission probability
 (rho) is a constant
 The Shodor
Education Foundation, Inc.