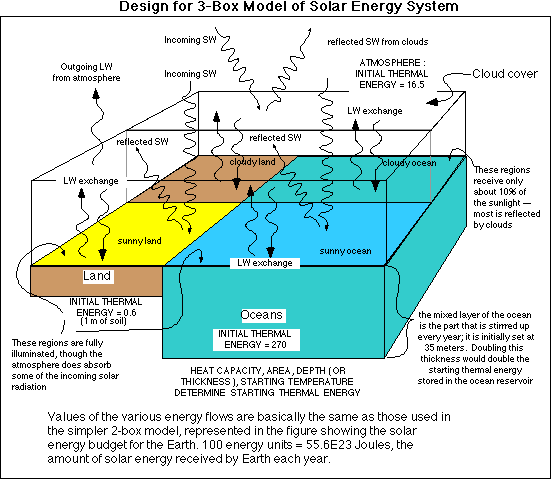
- Box 1: the atmosphere
- Box 2: the land
- Box 3: the ocean
The graphic at the right (click to see full-sized) shows in detail the workings of this particular applet.

| The graphic at the right shows the STELLA model used to create this applet (model design by David Bice, Carleton College, used by permission). If this is your first exposure to a STELLA model, you should read the brief Interpreting STELLA diagrams. It might also be helpful to print out this diagram and the schematic above to see how STELLA was used to represent the processes and values in the schematic. You can also look at the equations for this model. |

|
What you are measuring here is the global temperature in degrees C. Make sure you have the output box "Global Temp in Celsius" checked. The applet runs automatically whenever you change a value.
You can experiment with the model by changing the slider bars at the top right of the applet. The model will change immediately in response to a change in the slider bars. Depending on your choice of input values, you may need to change the scale of the graph, currently set for 10-25 degrees Celsius. You can also run the model for a longer period of time by changing the default value of one (1) year to some larger time period.
As an example experiment: what is the effect of increasing the amount of solar input by 3% (0.03 should be in input value for "Percent change in input value"). You should notice that the global temperature increases in response to this increase in solar input.