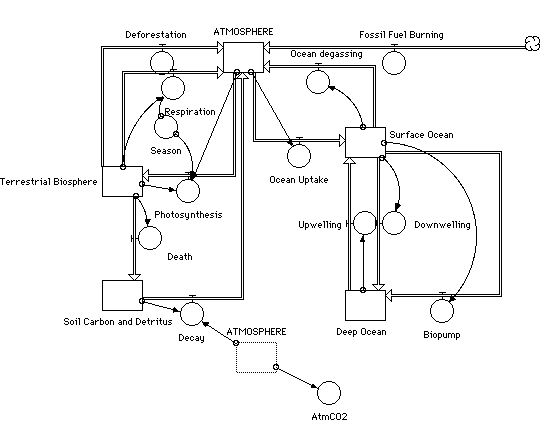
The computational model, as modeled with the commercial software package STELLA®, is shown in the graphic below:

The rectangles represent the reservoirs, each with some initial value (in gigatons of carbon). The fluxes/flows are represented by the large arrows with the circles attached. These are in units of gigatons/year. The simple circles, known as "converters", hold numerical constants or algebraic formulas representing specific mathematical functions.
We are interested in evaluating the amount of carbon in the reservoirs at any given period of time over the life of the simulation, specifically the amount of atmospheric carbon present. The flows represent the various processes that affect the amount of carbon that might be deposited or removed from a reservoir. Included in the flows are equations to calculate seasonal photosynthesis, up- and downwelling, degassing, ocean uptake, respiration, death, decay, and others. The mathematical equations are available for preview.
The basic equations represent the mathematics required to represent the "natural" transport of carbon through this system. To add an anthropogenic variable to the mix, we included the addition of carbon to the atmosphere reservoir through fossil fuel burning (estimated to be 5 gigatons per year) and the effect of deforestation (two additional gigatons moving from the terrestrial biosphere to the atmosphere). In this model, you can experiment with changing these two variables (along with most of the others) in the model.
Once you click on the "runnable" icon below, you will be presented with a form that allows you to change the parameters of the model run and the layout of the results graph. Once you click on the "submit" button, a Fortran model will be run on an SGI Indy2 scientific workstation, with the results returned to you as a graphic.
Last modified: