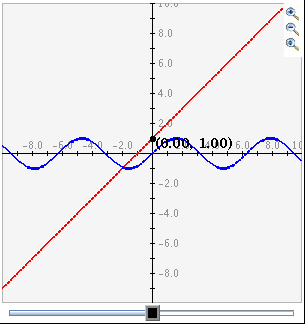
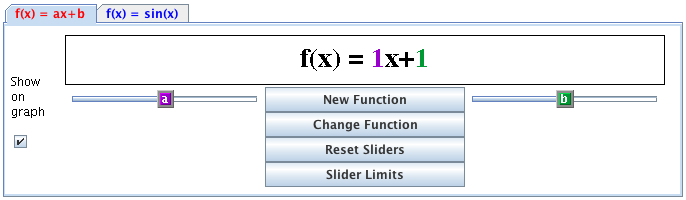
In a graph, a continuous line with no breaks in it forms a continuous graph
function
A function f of a variable x is a rule that assigns to each number x in the function's domain a single number f(x). The word "single" in this definition is very important
graph of the function f
The set of all the points on the coordinate plane of the form (x, f(x)) with x in the domain of f
infinity
Greater than any fixed counting number, or extending forever. No matter how large a number one thinks of, infinity is larger than it. Infinity has no limits
logarithm
The exponent of the power to which a base number must be raised to equal a given number. An example: 2 is the logarithm of 100 to the base 10. One can look at this way: 10 * 10 = 100, which is the same as 102, and 2 is the exponent referred to above
slope of a linear function
The slope of the line y = mx + b is the rate at which y is changing per unit of change in x. The units of measurement of the slope are units of y per unit of x (cf. Linear Functions Discussion).
Lesson Outline
Focus and Review
Conduct a review of limits, infinity, and slope to prepare students for the upcoming lesson. Focus
on the idea that limits allow you to work with ideas such as
and sometimes find a meaningful value for them. This will help mentally prepare students to find
the slope of a curve at a single point.
Ask the following opening questions:
What does it mean to say that a line is
tangent to a curve?
Do all lines tangent to a single curve have the same slope?
How can we find the slope of a line?
Objectives
Let the students know what it is they will be doing and learning today. Say something like this:
Today, class, we are going to learn how to find the slope of lines that are tangent to curves.
We are going to be working with computers, but please do not turn on your computers just yet.
I want to show you something first.
Teacher Input
To graphically demonstrate the concept of the "slope" of a curve, open
Multi-Function Data Flyer on a projector and show students the following equation:
The graph should look something like this:
Demonstrate the use of the sliders to change the equation of the straight line.
Ask the following questions:
Is the straight line currently tangent to the graph of sin(x)?
What could we do to the graph to make the line tangent to sin(x)? Should we change the slope,
the y-intercept, or some combination of the two?
Have students guide you until the line is tangent to the curve. The equation should be one of
the following:
y = 1x + 0
y = 0x + 1
y = 0x - 1
Click the zoom button, then click and drag to zoom in on a small area of the graph. Continue to do
so until the visible part of the graph of sin(x) looks like a straight line. Ask the following
questions:
Would it be relatively easy to find the slope of the tangent line to the curve?
How close is the tangent line to the actual curve graph of sin(x)?
If the slope of the tangent line to sin(x) at 0 is 1, what is the slope of the curve itself?
How do you know?
Guided Practice
Introduce
Derivate as an applet that can automatically find the slope of any function, even a curved function. Graph
the function
y=sin(x).
Demonstrate how to move the sliders to change the location of the tangent line.
Show how the derivative changes as the slope of the line changes.
Demonstrate how to change the window and step size as necessary to make functions easier to
see.
Discuss the relationship between the slope of the tangent line and the curve itself. Ask the
following questions:
When the function is increasing, is the derivative positive or negative?
When the function is decreasing, is the derivative positive or negative?
What happens to the derivative when the function is at a peak or a valley?
Independent Practice
Have students work in groups of 2-4 to complete the
worksheet. As they do so, ask them to think about the relationship between the derivative of a function and
the function itself.
Closure
Bring the class back together and discuss what has been learned about derivatives, tangents, and
slope. Ask the following questions:
How does the derivative of a function relate to the function at a particular point?
Do you think that all functions have a derivative at all points?
What if you had a function like
y =
x^1/3? What happens to the derivative of this function at zero?
What does this tell you about when it is possible to take the derivative of a function?
When you plotted the derivative of
on the worksheet, did the points form a graph? What graph did they form?
Given that, what would you say the general derivative of
is?
Do you think other functions could also have derivatives that are themselves functions?
Alternate Outline
The activities in this lesson can be rearranged in the following ways:
If only one computer is available, work on the worksheet as a class and have students plot
points from the overhead on their own paper. Then, discuss what graph is formed by those
points.