|
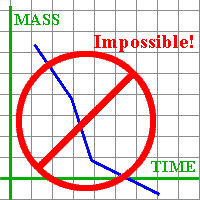
Student: What does it mean for a graph to be impossible? After all, it is just an abstract picture. Mentor: When people call a graph impossible, they usually mean that the graph contradicts some existing laws of physics, mathematics or other science. For example, a graph may show negative mass:
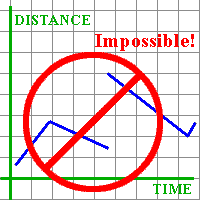
Student 1: I can make another graph that would be impossible for many situations in the real world. If there is a graph of distance vs. time, it can't have gaps, if it represents the real world in a continuous way. This graph shows breaks in time:
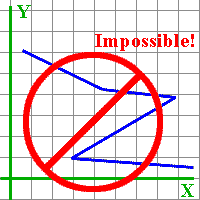
Student 2: It would be possible if we had a transporter from science fiction movies... Mentor: That's true! We can distinguish between a continuous graph which you could draw without ever lifting your pencil, and a discontinous graph which may have gaps, as long as it has one and only one value for the y-value for each x-value. Let's try one more idea that is related to the graph of a function. Sometimes the goal of a graph changes what is possible to impossible. For example, the following graph would not be possible as a graph of a function; do you know why?
Student: Because no function can have more than one dependent or output value for any value of the independent or input variable. On this graph, for every X between about 3 and 8 units, the graph has three values, so it cannot represent a function. Mentor: As you can see, to decide whether each graph is possible or not, we mostly need common sense. Student: It also helps to know the laws! Mentor: That's true. Knowing the laws could never hurt.

Please direct questions and comments about this project to Addison-Wesley math@aw.com © Copyright 1997-2001 The Shodor Education Foundation, Inc. © Copyright 2001 Addison-Wesley. All rights reserved. |


