|
A Survey of Mathematics Related Topics: Pg. 60, Example 1 Venn Diagrams were first developed by John Venn in the 1880s. They are useful for illustrating the relationships between elements in a set. For example if we want to represent the set of all counting numbers, and illustrate how even numbers and multiples of 3 are related, we could draw the following picture: 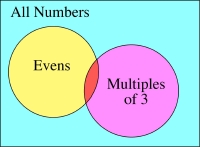
See how the circles overlap but not completely -- why? Because although some numbers (like the number 6) are both even and a multiple of 3, there are many numbers who are even and not multiples of 3 (like 4 or 8) and vice versa (like 9 or 15). Numbers which are in both sets would be located in the little red sliver where the circles overlap.
Please direct questions and comments about this page to interactivate@shodor.org © Copyright 1997-2000 The Shodor Education Foundation, Inc. |